Figure 1.
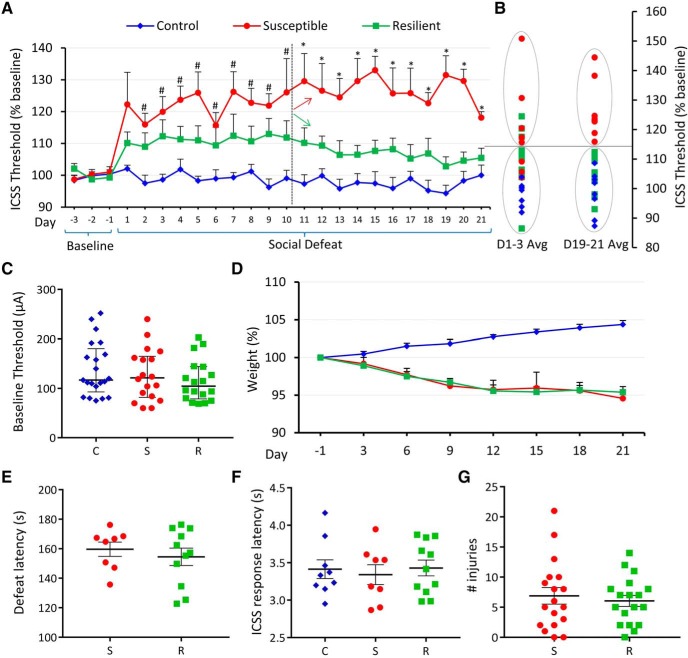
Susceptible rats show elevated ICSS thresholds during stress. A, Daily ICSS thresholds (mean across animals + SEM) plotted as percentage of baseline for 3 d before defeat and for each day of 21 d social defeat. Control rats (n = 9) represented by blue diamonds, susceptible rats (n = 8) by red circles, and resilient rats (n = 11) by green squares. Significant (p < 0.05) post hoc pairwise comparisons for each day shown above error bars. # indicates a significant difference between susceptible and control groups but not between other pairs. * indicates a significant difference between susceptible and control as well as susceptible and resilient groups. Dashed vertical line after Day 10 indicates the day from which susceptible (red arrow) and resilient (green arrow) groups differ significantly. B, A k means cluster analysis of Days 1–3 (left) and Days 19–21 (right). C, Absolute baseline ICSS current intensity thresholds (in μA) for each experimental group (C, control; S, susceptible; R, resilient). Values are median and interquartile range. D, Rat body weight (mean + SEM) in grams, measured every 3 d over 21 d period and plotted as percentage change relative to baseline (Day −1) for each group. E, Latency to supine submissive posture during social defeat, in seconds, plotted for stressed groups as mean ± SEM. F, ICSS response latency (mean ± SEM) in seconds, plotted for each group. G, Total number of injuries (mean ± SEM) suffered by each rat during 21 d social defeat plotted for stressed groups. B–E, Graph symbols as in A.

