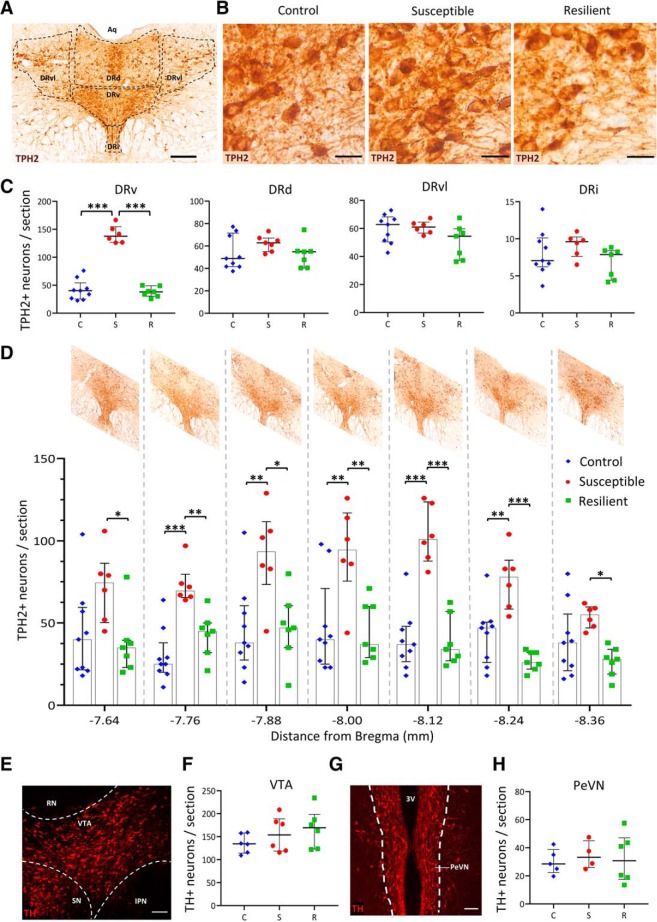
Figure 2.
Susceptible rats display more TPH2+ neurons in the ventral subnucleus of the DR. A, Representative image of a coronal section through the DR stained for TPH2 (brown) by DAB immunohistochemistry. Various DR subnuclei present at the mid-rostrocaudal level are outlined in black. Aq, Aqueduct of Sylvius. Scale bar, 200 μm. B, Representative images of DRv sections stained for TPH2 from each experimental group. Scale bars, 25 μm. C, Number of TPH2+ neurons in each subnucleus of the DR. Counts (per section) were averaged across rats [control (C), blue diamonds, n = 9; susceptible (S), red circles, n = 6; resilient (R), green squares, n = 7] and plotted as median with interquartile range. ***p < 0.001. D, Quantification of number of TPH2+ neurons in the DRv at 120 μm intervals along the rostrocaudal axis within the mid-rostrocaudal DR. Rostrocaudal positions represented on x-axis as distance from bregma in mm and representative images of the DR at each position are shown above. Counts were averaged across rats (graph symbols and sample sizes same as in C) and plotted as median and interquartile range. *p < 0.05, **p < 0.01, ***p < 0.001. E, Representative image of a coronal section through the VTA, seen unilaterally, outlined in white, stained for TH (red) to mark dopaminergic neurons. IPN, Interpeduncular nucleus; SN, substantia nigra; RN, red nucleus. Scale bar, 100 μm. F, Quantification of number of TH+ neurons per VTA section. Bilateral counts were averaged across six rats per group and plotted as median and interquartile range. Graph symbols as defined in C. G, Representative image of a coronal section through the PeVN, seen bilaterally, stained for TH (red) to mark dopaminergic neurons. 3V, Third ventricle. Scale bar, 100 μm. H, Quantification of number of TH+ neurons per PeVN section. Bilateral counts were averaged across rats (control: n = 5, susceptible: n = 4, resilient: n = 6) and plotted as median and interquartile range. Graph symbols as defined in C.

