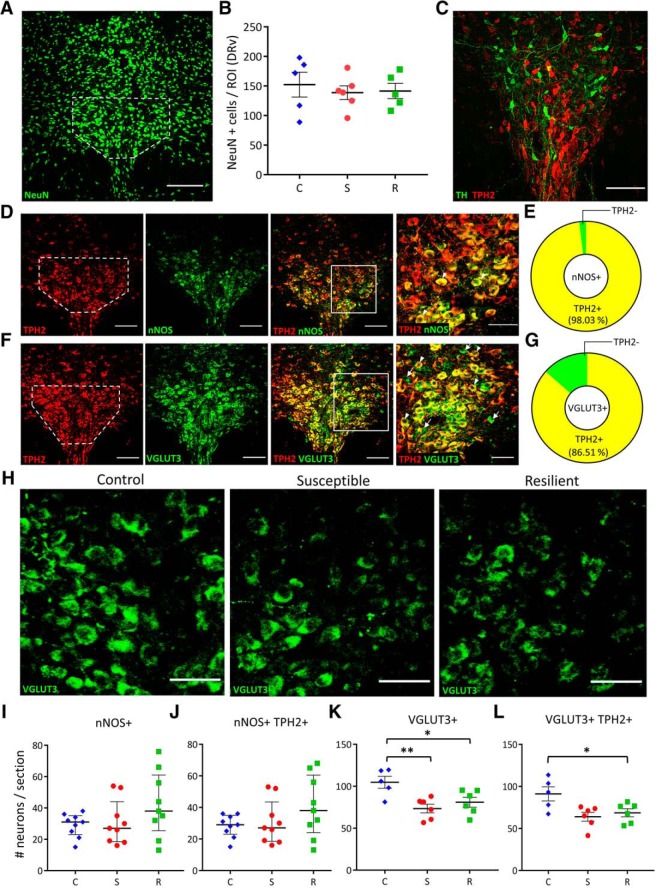
Figure 3.
Stressed rats have fewer VGLUT3+ neurons in the DRv. A, Representative image of a coronal DR section showing NeuN immunoreactivity. DRv margins outlined in white (as also in D, F). Scale bar, 200 μm. B, Quantification of NeuN+ cells in control (C; blue diamonds, n = 5 rats), susceptible (S; red circles, n = 6 rats), and resilient (R; green squares, n = 5 rats) groups. ROI, Region-of-interest. Counts were normalized to ROI area, averaged across rats per group and plotted as mean ± SEM. C, Representative image of a coronal DR section showing dopaminergic (TH+; green) and serotonergic (TPH2+; red) neurons but no coexpression. Scale bar, 100 μm. D, Representative images of a coronal DR section showing nitrergic (nNOS) neurons coexpressing TPH2. Left to right: TPH2 (red), nNOS (green), merge (scale bar, 100 μm), and higher-magnification of ROI in merged image (scale bar, 25 μm). Arrowheads indicate nNOS+ TPH2+ (yellow) coexpressing neurons. E, Quantification of TPH2/nNOS coexpression in the DRv. Yellow sector indicates percentage of nNOS+ neurons coexpressing TPH2. Green sector indicates nNOS-only neurons. F, Representative images of a coronal DR section showing glutamatergic (VGLUT3+) neurons coexpressing TPH2. Left to right: TPH2 (red), VGLUT3 (green), merge (scale bar, 100 μm), and higher magnification of ROI in merged image (scale bar, 50 μm). Arrowheads indicate VGLUT3+ TPH2+ (yellow) coexpressing neurons. G, Quantification of TPH2/VGLUT3 coexpression in the DRv. Yellow sector indicates percentage of VGLUT3+ neurons also expressing TPH2. Green sector indicates VGLUT3-only neurons. H, VGLUT3+ neurons in the DRv of control, susceptible and resilient groups (scale bar, 50 μm). I, J, Quantification of nNOS+ (I) and nNOS+ TPH2+ coexpressing (J) neurons in the DRv of control (C; blue diamonds), susceptible (S; red circles), and resilient (R; green squares). Counts were obtained from three sections each from three rats per group and plotted as median with interquartile range. K, Quantification of DRv VGLUT3+ neurons. L, Quantification of DRv VGLUT3+ TPH2+ coexpressing neurons. K, L, Counts were averaged across rats (control: n = 5, susceptible: n = 6, resilient: n = 6) and plotted as mean ± SEM. *p < 0.05, **p < 0.01. Graph symbols as defined in I.

