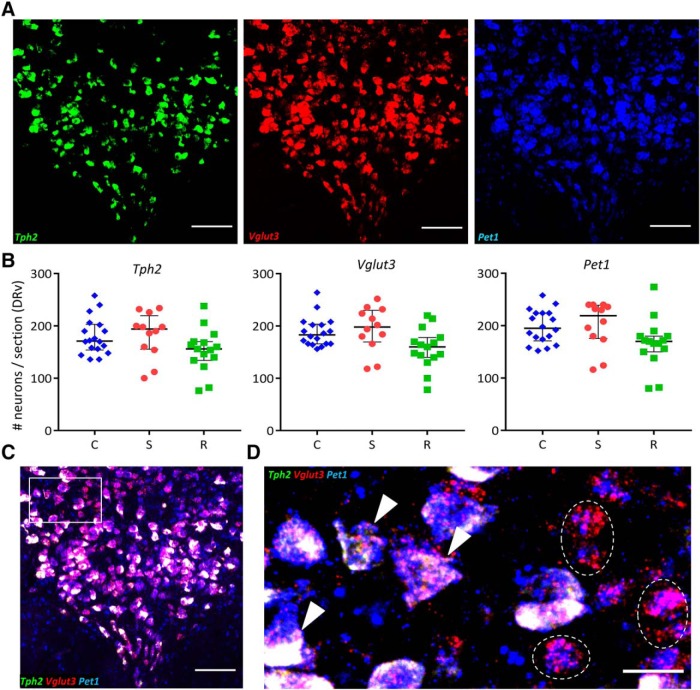
Figure 4.
Number of neurons expressing Tph2, Vglut3, or Pet1 mRNA does not differ across groups. A, Representative images of a coronal DR section processed for Tph2 (green), Vglut3 (red), and Pet1 (blue) triple in situ hybridization. Scale bars, 100 μm. B, Left to right, Quantification of number of neurons expressing Tph2, Vglut3, and Pet1 mRNA across control (C; blue diamonds, n = 5 rats), susceptible (S; red circles, n = 4 rats) and resilient (R; green squares, n = 4 rats) groups. Counts were obtained from 1 to 3 DRv sections per rat and plotted as median with interquartile range. C, Merge of three channels shown in A. Scale bar, 100 μm. D, ROI (rectangle in C) at higher magnification showing triple labeled (arrowheads), and non-serotonergic Pet1+ Vglut3+ Tph2− (dashed outline) neurons. Scale bar, 25 μm.

