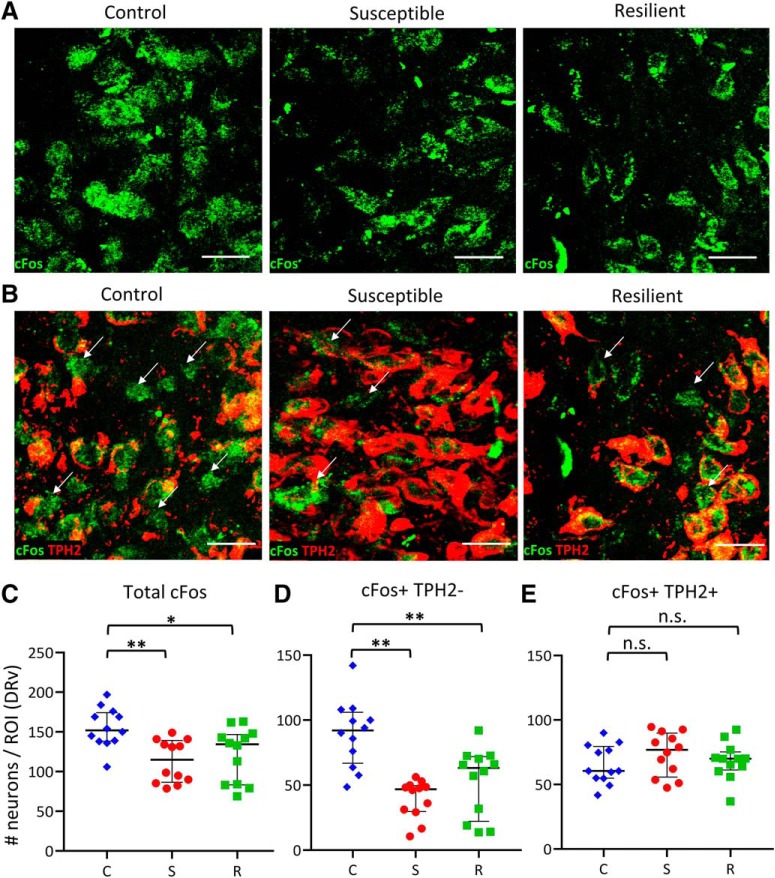
Figure 5.
Stressed rats have fewer active TPH2− neurons in the DRv. A, Left to right, Representative images of cFos immunoreactivity in DRv of control, susceptible and resilient rats. Scale bars, 25 μm. B, Left to right, Representative images of cFos immunoreactivity in TPH2+ (red) and TPH2− (arrows) neurons in DRv across groups. Scale bars, 25 μm. C–E, Quantification of total cFos+ (C), cFos+ TPH2− (D), and cFos+ TPH2+ (E) neuron number in control (C; blue diamonds), susceptible (S; red circles), and resilient (R; green squares) rats. Counts from four sections per rat were obtained from three rats per group, normalized to ROI area, and plotted as median and interquartile range. *p < 0.05, **p < 0.01; n.s., not significant (p > 0.05).

