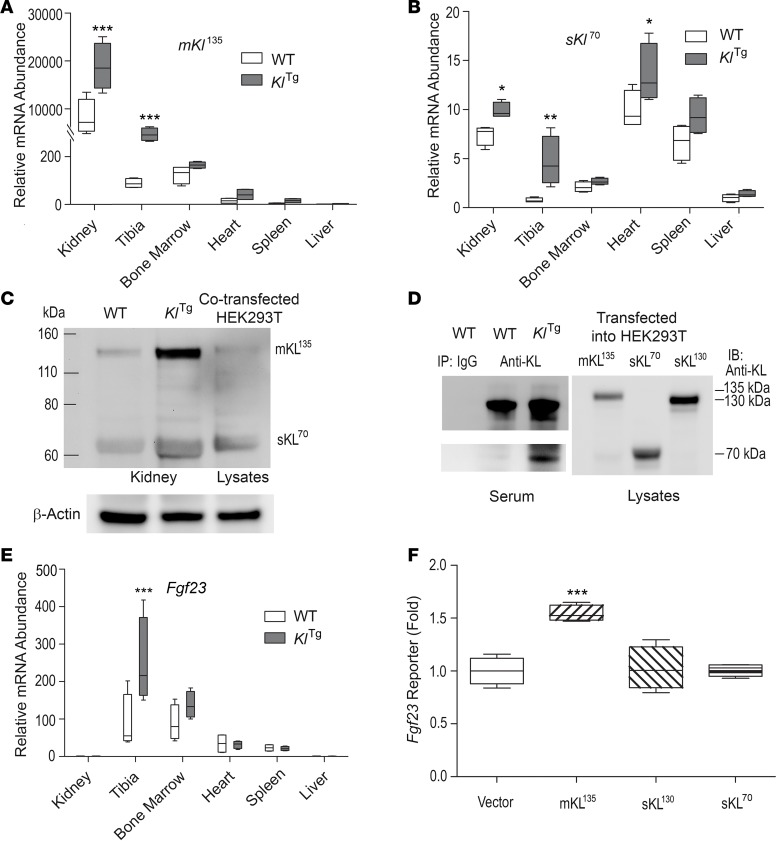
Figure 1. α-Klotho isoforms and FGF23 expression in α-Klotho–transgenic mice.
(A and B) Multiple-tissue real-time RT-PCR analyses for membrane (mKL135, A) and alternative spliced (sKl 70, B) Klotho transcripts. (C) Kidney Western blot analysis for mKL135/sKL130 and sKL70/sKL170 protein levels. (D) Serum immunoprecipitation of serum soluble Klotho proteins (sKL130 or sKL70/sKL170) with anti-Klotho KL1 rat mAb (KL-234). (E) Multiple-tissue real-time RT-PCR analyses for Fgf23 transcripts. (F) Regulation of Fgf23 promoter-luciferase reporter activities by transient overexpression of α-Klotho isoforms. Data are expressed as the mean ± SD from 8–10 mice or 3 independent experiments in triplicate. The box plots depict the minimum and maximum values (whiskers), the upper and lower quartiles, and the median. The length of the box represents the interquartile range. *P < 0.05, **P < 0.01, and ***P < 0.001 versus wild-type or vector alone control group.

