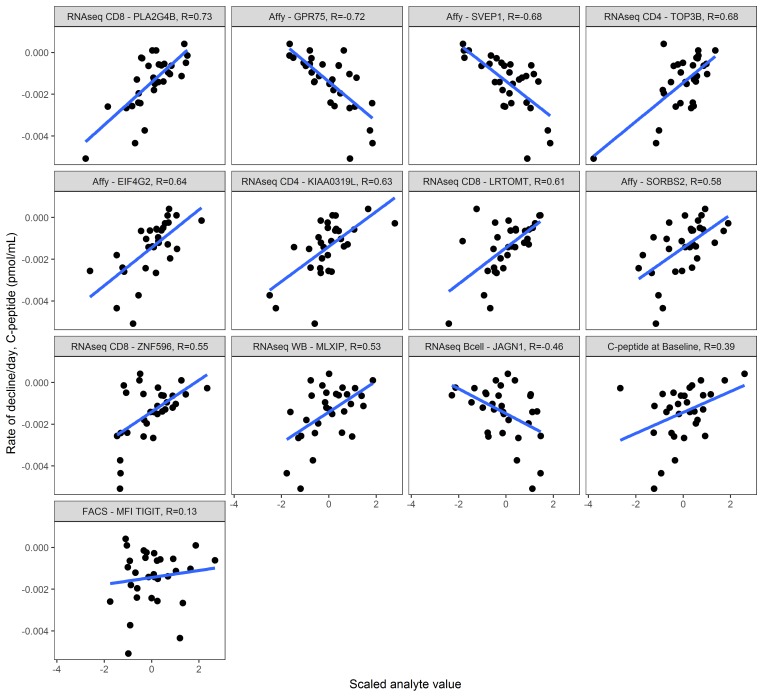
Figure 5. Individual correlations between each selected analyte and insulin secretion.
Immune markers were measured at trial enrollment (within 90 days of diagnosis, n = 30 subjects), and y axis indicates C-peptide decay rate per day over the 2 years after diagnosis. Each miniplot uses the scaled value for the analyte on the x axis. Pearson’s correlation values are listed at the top of each miniplot; miniplots are ordered by absolute correlation value. Regression lines in blue. Note that in this data set, several immune parameters have higher correlation values with rate of C-peptide decay than does C-peptide level at diagnosis (Pearson’s r = 0.39). Assays and analyte names are truncated; full names can be found in Table 3. “Affy” indicates the transcriptional response to T1D serum assay as this is conducted on the Affymetrix platform.

