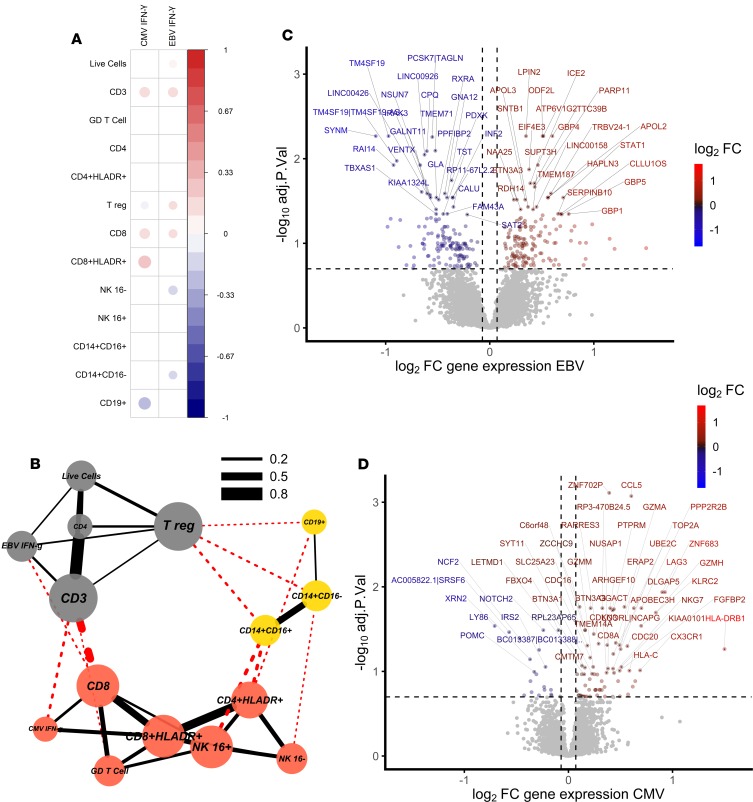
Figure 2. CMV infection is associated with CD8+ T cell activation in South African infants.
(A) Correlation matrix of significantly (Spearman’s rho, P < 0.05) correlated cell populations and IFN-γ ELISpot responses to EBV and CMV using cellular data. The magnitude of the CMV-specific IFN-γ ELISpot response correlated with the frequency of activated CD8+ T cells. (B) Network of positively correlating cell populations using cellular data (Spearman’s rho, P < 0.05) showing 3 clusters dominated by activated T cells with CMV, CD3+ T cells with EBV, and monocytes with B cells (node color indicates cluster membership using clusters defined by ref. 26; red, clustering with CMV response; gray, clustering with EBV response; and yellow, clustering with myeloid cells). Red lines indicate between-cluster correlations, and black lines within-cluster correlations. Line width indicates the correlation coefficient. (C) Volcano plot using transcriptomic data showing magnitude and significance of differential expression between EBV+ and EBV– infants, where blue indicates genes that are downregulated in EBV+ infants and red indicates genes that are upregulated in EBV+ infants. (D) CMV–strongly positive (ELISpot > 100 SFC/million) and CMV– infants, where blue indicates genes that are downregulated in CMV+ infants and red indicates genes that are upregulated in CMV+ infants. Gray indicates genes for which expression is unchanged. The top 50 significant genes are labeled, and horizontal and vertical dashed lines indicate 20% FDR and 5% change in gene expression, respectively.

