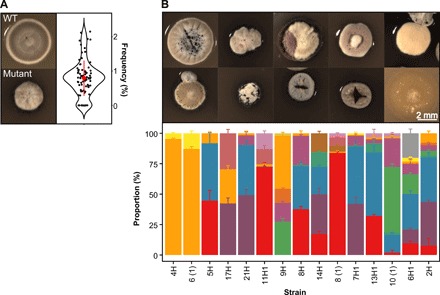
Fig. 1. Emergence of phenotypic heterogeneity in colonies of S. coelicolor.

(A) WT (top) and mutant (bottom) colonies and the frequency that mutants emerge from WT colonies on SFM agar (right). (B) Phenotypically diverse progeny (top) emerges after restreaking mutant colonies that vary in size, shape, and pigmentation. Representative colonies are shown. The bottom graph depicts the range of distinct morphologies that emerge after restreaking 15 random colonies. Each color represents a distinct colony phenotype.
