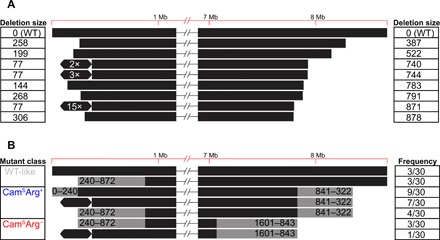
Fig. 2. Genome diversity of mutant colonies determined from whole-genome sequencing and PFGE.

Values in (A) correspond to the size (in kilobases) of genome deletions, while the hexagons represent an ~297-kb genome amplification. Each line in (B) depicts the range of deletion sizes (gray) in each mutant class, together with their respective frequencies from 30 sampled mutant strains.
