
Fig. 5. Preferential microglia proliferation and infiltrating macrophage apoptosis in the lesioned CNS.
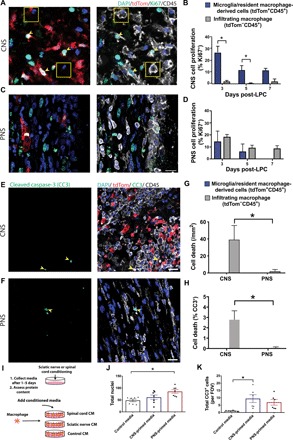
(A and C) Representative immunohistochemical images of the lesioned spinal cord (A) and sciatic nerve (C) demonstrating more proliferative (Ki67+, green) reporter-positive cells (yellow, arrowheads) compared to reporter-negative cells (white, boxes) in the CNS and no difference between cell types in the PNS. This observation was also reflected in quantification (*P < 0.02) (B and D). (E and F) Representative immunohistochemical images of the lesioned spinal cord (E) and sciatic nerve (F) at 3 days after LPC demonstrating more apoptotic (CC3+ green) infiltrating macrophage (CD45+ tdTom−, yellow, arrowheads) in the CNS versus the PNS. This observation was also reflected in quantification (*P < 0.03; G and H). (I to K) Using conditioned media (CM) from spinal cord (CNS) and sciatic nerve (PNS) on BMDM, we demonstrated a reduction in cell numbers (J) and an increase in apoptosis (CC3+ cells; K) in CNS-primed media conditions compared to PNS-primed media. n = 6 to 7, *P < 0.02. (B), n = 3 to 4 (D); two-way ANOVA with Sidak’s multiple comparison test; n = 4 (PNS) and 9 (CNS) two-way ANOVA with Sidak’s multiple comparison test (G and H); n = 6 (two independent experiments) ANOVA with Tukey’s multiple comparison test (I to K); Error bars indicate ± SEM. Scale bar, 20 μm. FOV, field of view.