
Fig. 2. inRas37 exerts a potent antiproliferative action on KRASMUT cell lines by inhibiting KRASMUT downstream signaling.
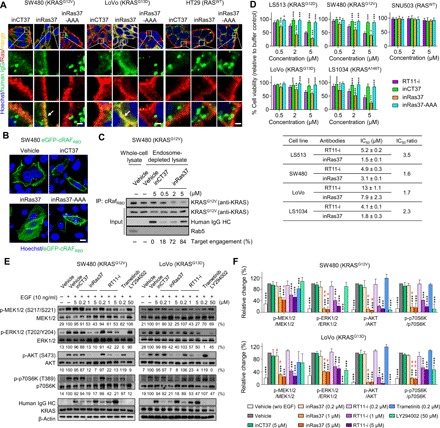
(A) Cellular internalization and colocalization of the indicated antibodies (green) with activated RAS (red) in SW480, LoVo, and HT29 cells treated with 1 μM antibody for 12 hours before microscopic confocal analysis. The arrow indicates the colocalization of inRas37 with activated RAS. Scale bars, 5 μm. (B) Cytoplasmic distribution of the eGFP-cRAFRBD protein (green) in eGFP-cRAFRBD–transformed SW480 cells treated with 1 μM antibody for 12 hours before microscopic confocal analysis. Scale bar, 20 μm. (C) Immunoprecipitation (IP) of active KRASG12V with cRAFRBD from endosome-depleted cell lysates of SW480 cells following treatment with the indicated antibodies at the indicated concentrations for 12 hours. The Rab5 protein was analyzed as an early endosome marker. The number below the panel indicates a percentage of target engagement. (D) Viability of RASWT and various KRASMUT cell lines after treatment every other day (days 0, 2, and 4) with the indicated antibodies at the indicated concentrations for 6 days in three-dimensional spheroid cultures. *P < 0.05, **P < 0.01, and ***P < 0.001 versus the RT11-i–treated group. Bottom: IC50 values for RT11-i and inRas37 toward each cell line. The IC50 ratio was calculated as the IC50 of RT11-i divided by the IC50 of inRas37 for each cell line. (E and F) Representative images (E) and pooled densitometry data (F) of Western blots for SW480 and LoVo cells treated with the indicated antibodies, MEK1/2 inhibitor trametinib, or PI3K-AKT inhibitor LY294002 for 12 hours and then stimulated with EGF (10 ng/ml) for 10 min before cell lysis. The relative band intensity of the phosphorylated proteins toward that of respective total protein was expressed as a percentage of that in the buffer control. The number below the panel indicates the mean (E), and error bars represent means ± SD (F) of at least three independent experiments. ***P < 0.001 for each group versus EGF-stimulated vehicle-treated control; #P < 0.05 and ##P < 0.01 for inRas37 versus RT11-i at each equivalent concentration in each sample (unpaired two-tailed Student’s t test).