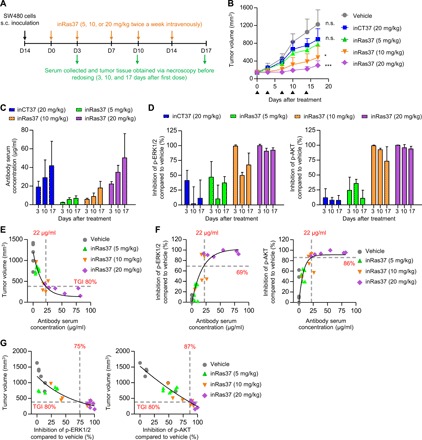
Fig. 4. In vivo antitumor activity of inRas37 correlates with the serum concentrations and target inhibition in the KRASG12V SW480 CDX mouse model.

(A) Schematic of dosing and PK and PD assessment of inRas37 in KRASG12V SW480 CDX-bearing BALB/c nude mice. s.c., subcutaneous. (B) Tumor growth curves in response to intravenous injection of the indicated antibodies at the indicated dose twice a week (arrowheads) for a total of five doses (n = 6 per group). *P < 0.05 and ***P < 0.001 versus inCT37; n.s., not significant. (C and D) Serum concentrations of the indicated antibodies (C) and percentage inhibition of p-ERK1/2 (left) and p-AKT (right) formation in tumor tissue lysates (D), as determined before antibody dosing on days 3 and 10 and at the end of treatment on day 17 (n = 3 per group on days 3 and 10 and n = 6 per group on day 17). (E and F) Plot of serum concentrations of inRas37 versus tumor volume (E) and versus percentage down-regulation of p-ERK1/2 (left) and p-AKT (right) (F) on day 17 (n = 6 per group). (G) Plot of tumor volume versus percentage down-regulation of p-ERK1/2 (left) and p-AKT (right) on day 17 (n = 6 per group). In (E) to (G), solid curves indicate the fit to the data via a four-parameter logistic equation.
