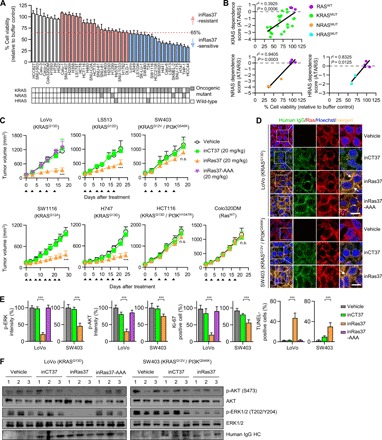
Fig. 5. In vitro responses of various RASMUT cell lines to inRas37 correlate with the in vivo responses.

(A) Viability of various RASMUT and RASWT cell lines after treatment every other day (days 0, 2, and 4) with inRas37 (2 μM) for 6 days as compared with buffer-treated control (n = 3). Bottom: Mutation status of RAS genes in the cells. RASMUT cells are colored according to the inRas37 sensitivity threshold at 65% cell viability. (B) Cell viability under the action of inRas37 treatment plotted versus KRAS, NRAS, or HRAS dependence scores (ATARiS) from Project DRIVE. Statistical analysis was performed using linear regression to determine r2 and P values. (C) Tumor growth curves in response to intravenous injection of the indicated antibodies at 20 mpk twice a week (arrowheads) into BALB/c nude mice harboring the indicated tumor xenografts. Error bars, ±SD (n = 6 per group, except for LoVo, n = 7 per group). ***P < 0.001 versus the inCT37 group. (D) IHC analysis of the indicated antibodies (green), with activated RAS (red) in KRASMUT LoVo and SW403 tumor tissues prepared 24 hours after the last treatment. The arrows indicate the colocalization of inRas37 with activated RAS. Scale bars, 10 μm. (E) IHC analysis of p-ERK1/2 (green), p-AKT (green), and Ki-67 (red) and TUNEL (green) staining levels in LoVo- and SW403-derived tumor tissues, as shown in fig. S6B. The panels show the percentage of relative fluorescence intensity compared to that in the vehicle-treated control and the percentage of Ki-67–positive and TUNEL-positive cells compared to the number of Hoechst 33342–stained cells in each sample. Error bars represent means ± SD of five random visual fields for each sample (two tumors per group). ***P < 0.001. (F) Western blot analysis of the indicated proteins in LoVo and SW403 tumor tissue lysates. In (D) to (F), tumor tissues were excised from mice 24 hours after the last treatment, as shown in (C).
