
Fig. 2. Uptake of beads by cancer cells has a nonmonotonic dependence on the bead size.
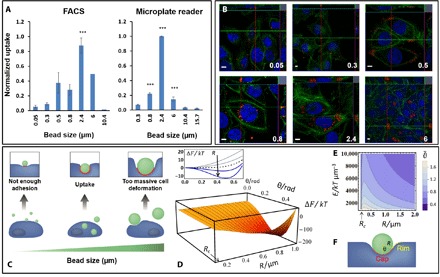
Cancer cell interaction with inert spherical fluorescent polystyrene beads increases with bead size, reaching a maximum around 2.4-μm bead diameter and then decreases. (A) Left: FACS analysis; average over normalized uptake values of eight cell lines: A375-p, A375-SM, PC3M-P, PC3M, LN4253J, 253 J-B5, SN12, and SN12-C. Right: Microplate fluorescent analysis (excitation, 530/25 and emission, 590/20), average over normalized uptake values of A375-P, A375-SM, PC3M-P, and PC3M-LN4. (B) Confocal fluorescent images (blue, DAPI; green, fluorescein isothiocyanate–phalloidin; red, polystyrene fluorescently labeled beads). Scale bars, 10 μm. (C) Physical model predicted the nonmonotonic dependence due to the interplay between adhesion and cell deformability. (D) The free energy of the wrapping model has a minimum as a function of both the bead radius and the wrapping angle, ϑ (bottom); however, for small beads of R < Rc, there is no stable adhesion [top; plots downward are for R = 0.05, 0.11, 0.14 (Rc, dashed), 0.18, and 0.23 μm]. (E) The stable adhesion angle, (rad) is shown versus Young’s modulus and R. (F) Model geometry. Parameters used in plots of (D) and (E) are based on AFM calculations in PC3M-LN4 cells (see table S1).