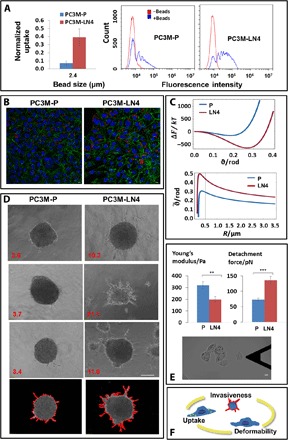
Fig. 3. TrC in primary versus metastatic cancer cells.

(A to C) Uptake comparison of 2.4-μm beads in primary versus metastatic cell lines of prostate cancer, PC3M-P and PC3M-LN4, respectively, showing elevated uptake by the metastatic cells: (A) FACS analysis, (B) confocal images (scale bars, 10 μm), and (C) results of the theoretical model with specific parameters of PC3M-P and PC3M-LN4: ΔF (ϑ) curves for R = 2.37 μm (top) as well as (R) (bottom) demonstrate that the metastatic cells internalize more particles. (D) Spheroid invasion test shows enhanced invasiveness of the metastatic compared to the primary cells. Compactness values are shown in red. At the bottom shown are examples of image analysis made for calculating the compactness of the microscope snapshots above them. Scale bar, 100 μm. (E) A comparison of the mechanical properties of the cells: Young’s modulus and the maximal adhesion force, using AFM, show that the metastatic cells are more elastic and more adhesive than the primary cells. A typical snapshot of a PC3M-LN4 cell from the AFM microscope is shown. Scale bar, 10 μm. The results presented in (A) to (E) support the TrC as shown in the cartoon (F). The PC3M-LN4 cells have higher uptake capacity (A and B), and they are more invasive (D) and are more deformable (E) in comparison with the PC3M-P cells, as also supported by the physical model in (C).
