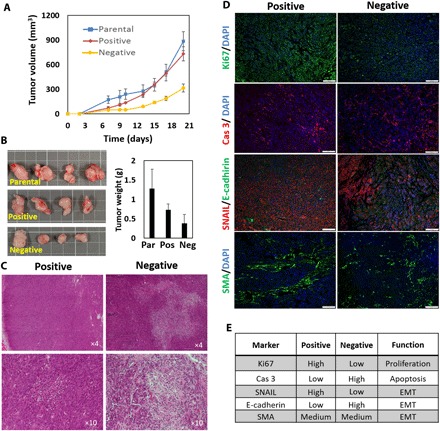
Fig. 6. TrC in uptake-based sorted cells was validated in a xenograft study.

Parental, positive, and negative A375-P cells were injected subcutaneously to athymic nude mice. (A) Induced tumors were measured every other day from day 9 following the injection. The negative tumors were notably smaller in volume than the positive and the parental ones. (B) Extracted tumor tissues from the negative group were notably smaller compared with the positive and the parental tumors, as demonstrated visually and by weight measurements. Photo credit: O. Benny, HUJI. Square scale, 1 cm. H&E staining of the extracted tumors showed dense and highly proliferative tissues of the positive tumors (C) and, in contrast, large areas of necrosis in negative ones (D). Immunohistochemical staining for evaluating proliferation (anti-Ki67 in green), apoptosis [anti-cleaved caspase-3 (Cas 3) in red], and EMT (anti-SNAIL/SLUG in red versus anti–E-cadherin in green, as well as SMA in green). Positive tissues showed a higher level of proliferation (Ki67 staining), while negative tissues showed a higher level of apoptosis (cleaved caspase-3). SNAIL/SLUG versus E-cadherin show enhanced EMT in the positive tumors compared to the negative ones, while SMA values were similar. Scale bars, 100 μm. (E) A qualitative summary of histological immunohistological analysis as determined visually from captured images. Grading is based on positive-stained areas in a given tissue.
