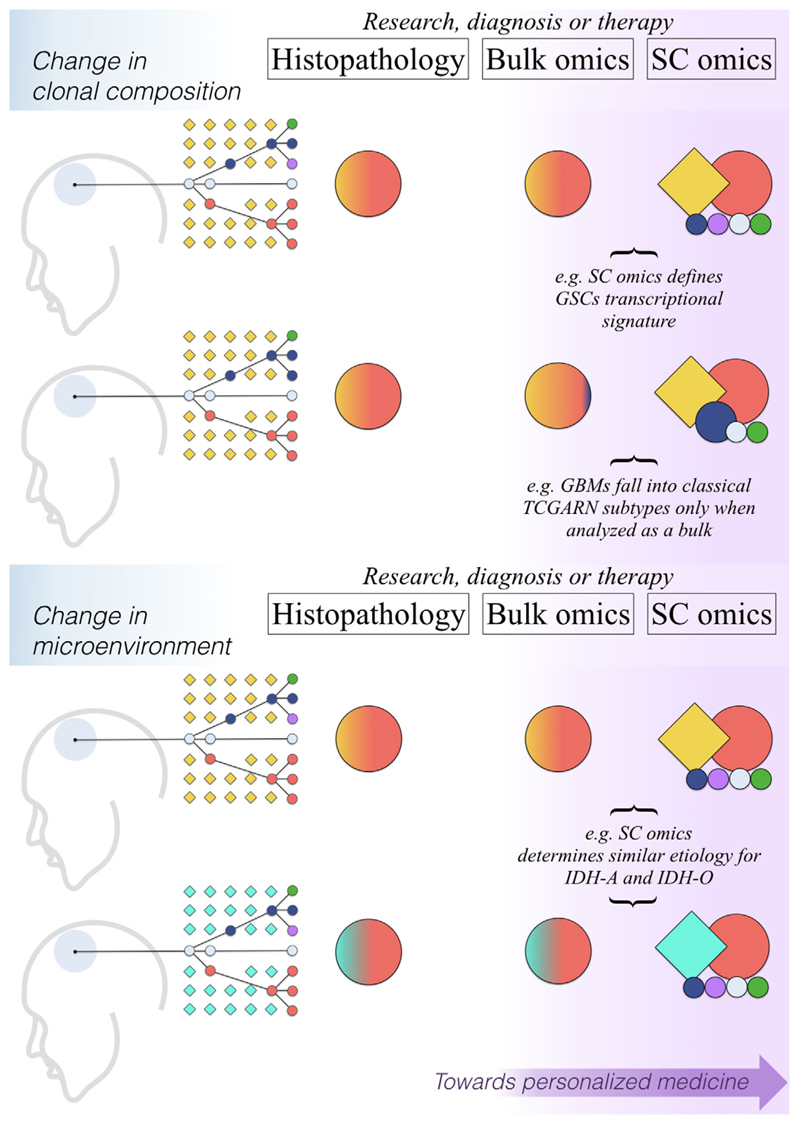
Figure 2.
Single-cell omics push a shift in paradigm for glioblastoma study and treatment. Each of the four sketches on the left depicts a glioblastoma (GBM) site (pale borderless head area) with a representation of cell lineages found in it, circles representing cancer cells, squares symbolizing surrounding non-tumor cells (colors mark individual lineages, connecting lines indicate hypothetical phylogenetic relationships between GBM cells). “Research, diagnosis or therapy” tables report a simplification of typical outcomes for each of the three exemplified approaches to research, diagnosis, or treatment for GBM. Object colors indicate cell lines dictating results; their size correlates with the magnitude of the distinguishable signal they generate, and their shape indicates whether they can exquisitely associate a given signal to either tumor (circles) or surrounding (squares) cells. IDH-A, IDH-mutant astrocytoma; IDH-O, IDH-mutant oligodendroglioma; GSC, glioblastoma stem cell; SC, single cell; TCGARN, The Cancer Genome Atlas Research Network.

