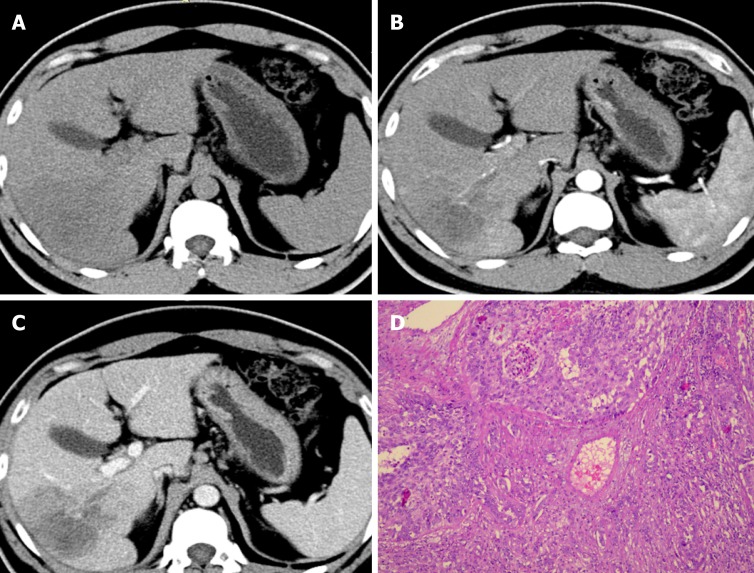
Figure 2.
Computed tomography images and histopathologic findings (100 ×). A-C: The right lobe of the liver shows a patchy low-density shadow of approximately 7.0 cm × 5.6 cm with heterogeneous enhancement on magnetic resonance imaging; D: The cells are spindle to round in shape, with scanty cytoplasm and hyperchromatic nuclei, forming nests and microglandular structures.

