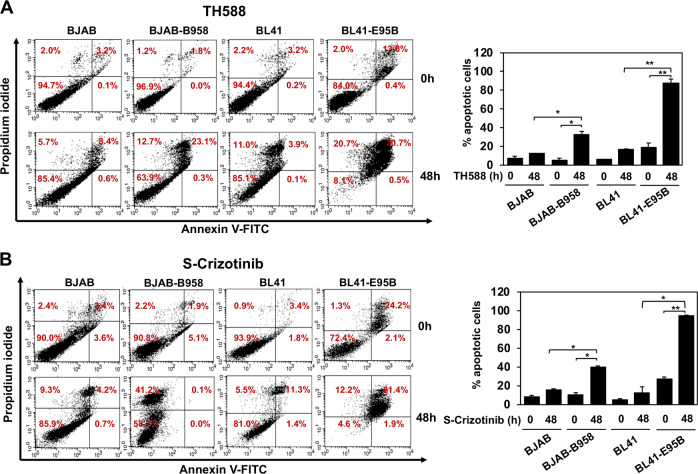
Fig. 5.
Small molecule inhibitors of MTH1 induce apoptosis in EBV positive cells. a Pairs of EBV-negative and -positive cell lines were treated with 10 µM of the MTH1 inhibitor TH588 for 48 h. Apoptosis was measured by Annexin V and PI staining. Bar graph depicts the percentage of apoptotic cells. Data are shown as the mean ± SD two independent experiments. *P < 0.05, **P < 0.01. b Pairs of EBV-negative and -positive cell lines were treated with 5 µM of the MTH1 inhibitor S-Crizotinib for 48 h and apoptosis was measured using Annexin-V and PI staining. Bar graph depicts the percentage of apoptotic cells. Data are shown as the mean ± SD of two independent experiments. *P < 0.05, **P < 0.01

