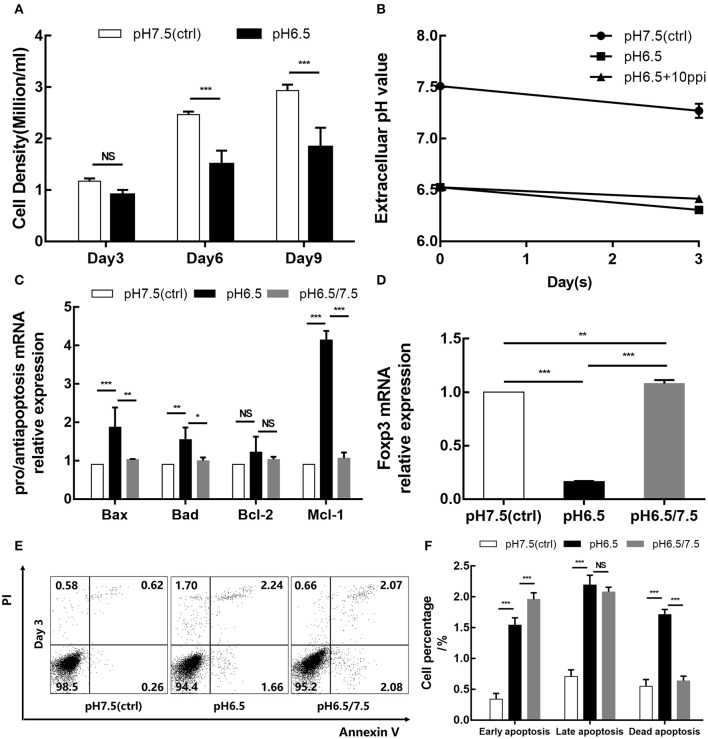
Figure 3.
Acidic microenvironment downregulates the iTreg proliferation and Foxp3 expression and promotes apoptosis of iTregs. (A) Cell density of the pH 6.5 and pH 7.5 groups by time point. (B) Changes in extracellular pH during cell culture. (C) Expression of pro-apoptotic genes (Bax and Bad) and anti-apoptosis genes (Bcl-2 and Mcl-1) measured by qRT-PCR at the transcriptional level after 3 days of culture. (D) mRNA expression of Foxp3 in iTregs measured by qRT-PCR at the indicated pH values after 3 days of culture. (E) Cell apoptosis after Annexin V/PI staining at the indicated pH values. (F) Statistical analysis of cell apoptosis by pH group. Data are presented as the means ± SD from three independent experiments. NS, not significant. *p < 0.05; **p < 0.01; ***p < 0.001.

