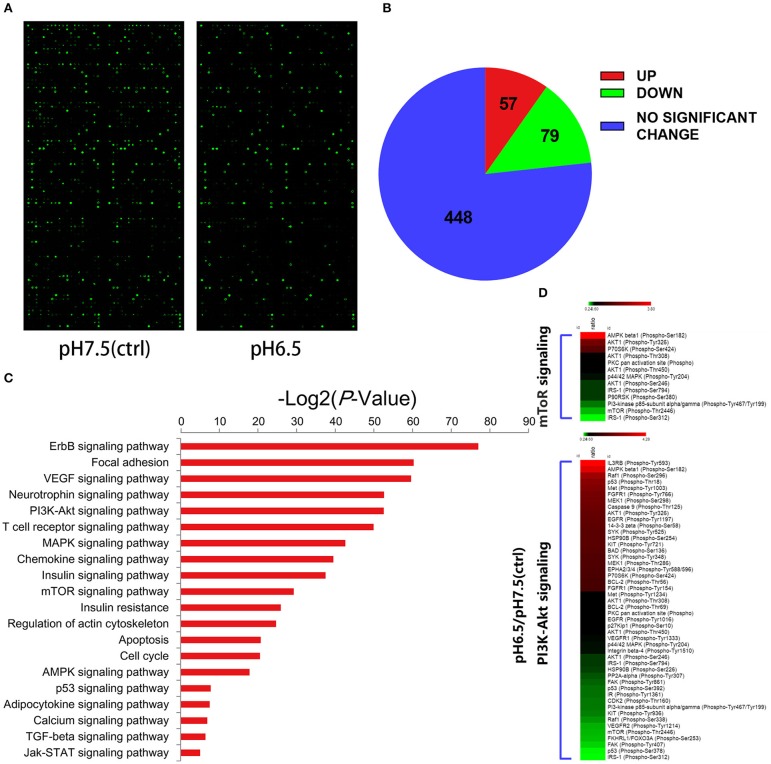
Figure 5.
Differential expression of phospho-specific protein between cells in the pH 7.5 and pH 6.5 groups. (A) Original images of phosphorylated protein chips by SureScan Dx Microarray Scanner from two groups. (B) Phosphorylation sites (582) of all (432) screened proteins based on a phospho-specific protein microarray analysis. (C) KEGG enrichment analysis of proteins in the phospho-specific protein microarray according to cellular component, biological process, and molecular function. (D) Heat map representing the fold change in the expression of different phosphorylated sites of proteins in the PI3K/Akt/mTOR signaling pathway (fold change Phos/Unphos ≥ 1.6).

