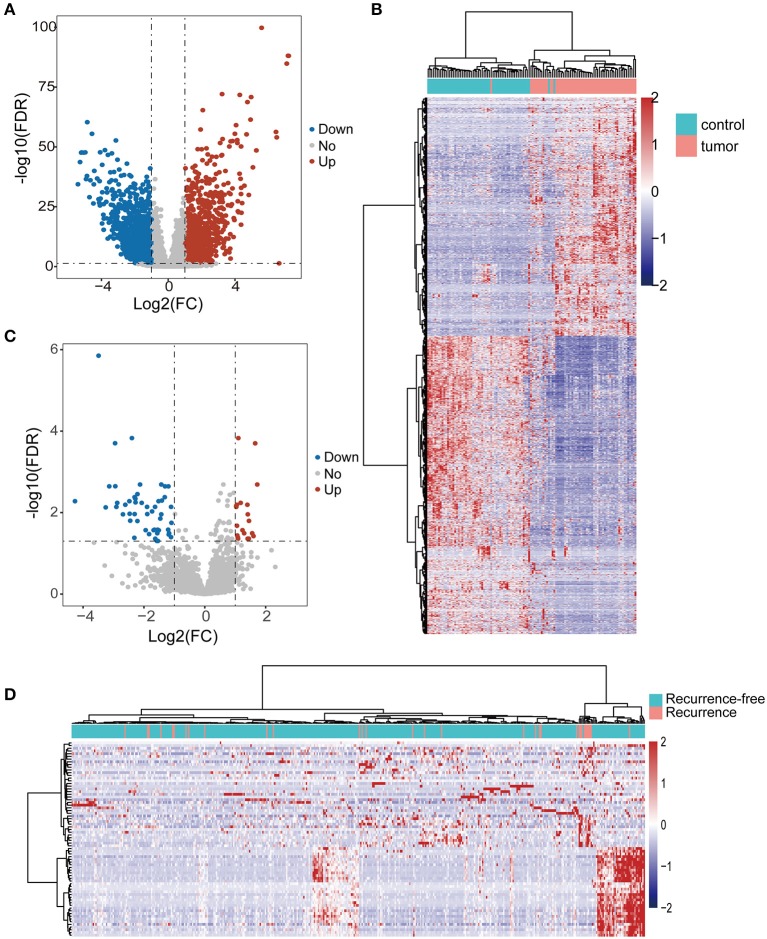
Figure 1.
Identification of differentially expressed lncRNAs. (A) Volcano plot of differentially expressed lncRNAs between tumors and normal tissues. Blue dots indicate down-regulated lncRNAs and red dots denote up-regulated lncRNAs. (B) The hierarchical clustering heat map of tumor samples and non-cancer tissues based on differentially expressed lncRNAs. (C) Volcano plot of differentially expressed lncRNAs between tumors with and without recurrence. Blue dots indicate down-regulated lncRNAs and red dots denote up-regulated lncRNAs. (D) The hierarchical clustering heat map of tumor with and without recurrence based on differentially expressed lncRNAs.

