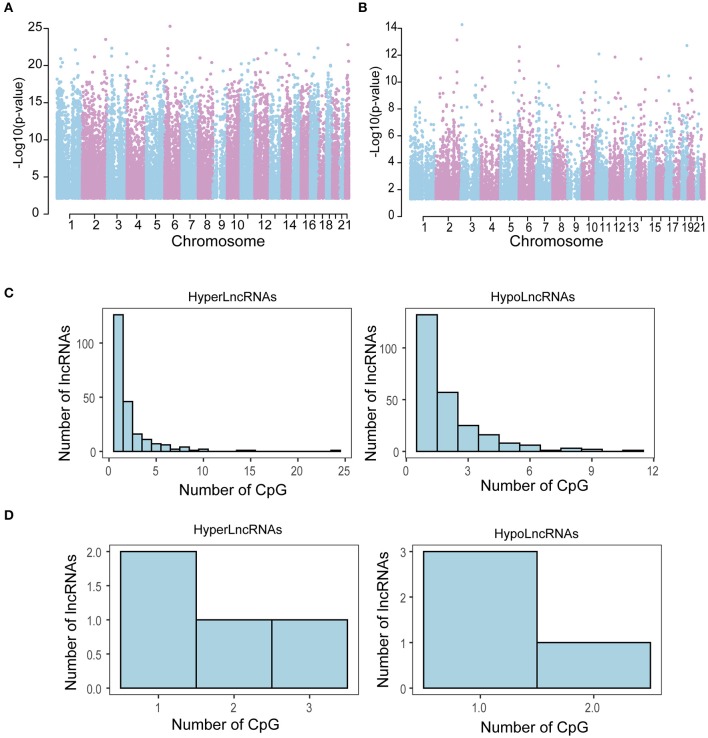
Figure 2.
Chromosome distribution of differentially methylated CpG sites. A Manhattan plot was drawn for differentially methylated CpG sites between tumors and adjacent normal tissue (A) and between tumors with and without recurrence (B). Distribution of HyperLncRNAs and HypoLncRNAs possessing different differentially methylated CpG sites associated with tumor development (C) and tumor recurrence (D).

