Figure 3.

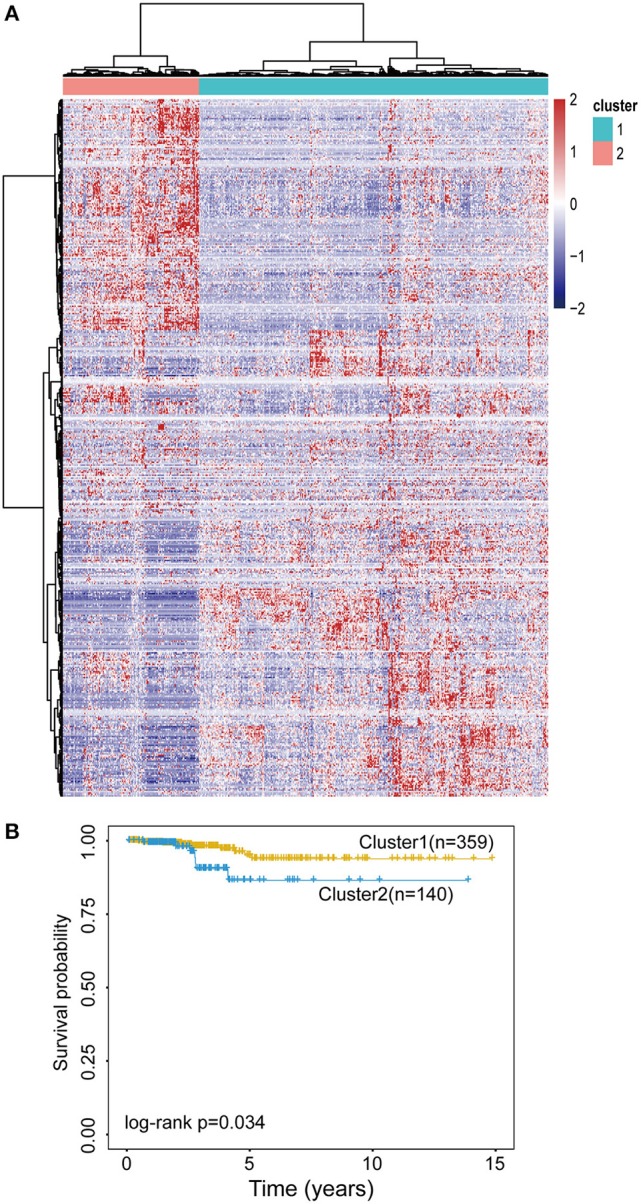
Evaluation of the prognostic value of the EpilncRNAs. (A) The hierarchical clustering heat map of THCA patients based on 483 EpilncRNAs. (B) Kaplan-Meier survival curves for two patient clusters.

Evaluation of the prognostic value of the EpilncRNAs. (A) The hierarchical clustering heat map of THCA patients based on 483 EpilncRNAs. (B) Kaplan-Meier survival curves for two patient clusters.