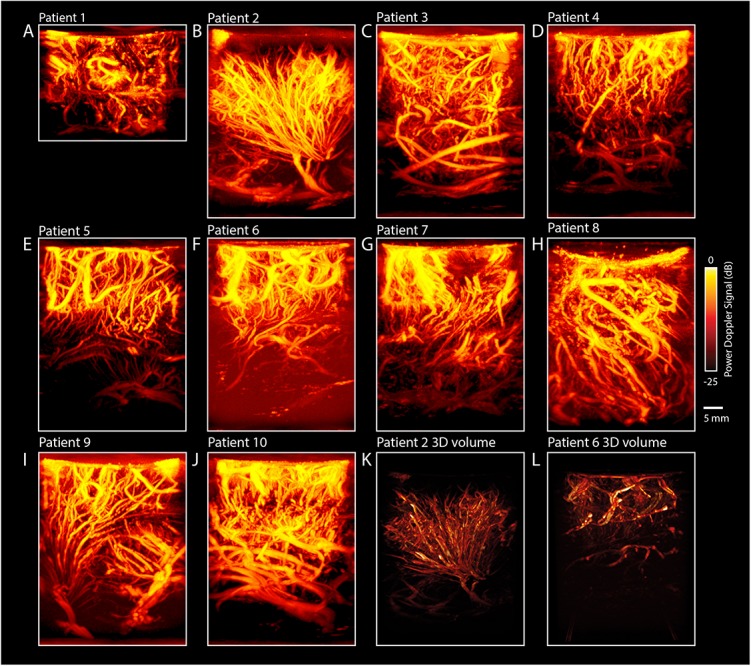
FIGURE 4.

Maximum Projections of all patients (n = 10). (A–J) In addition to the regular 2D-images, we also made maximum projection images, showing an overview of the maximum signal per pixel during the imaging session of 60 s. As such, a single image with more depth-information can be created. For each patient, the most vascular-dense pre-resection image is highlighted, revealing a rich diversity in vascular patterns across patients. (K) 3D-overview of the pre-resection tumor vasculature images as acquired intra-operatively for pt.#2. Pre-operative MRI showed a suspected LGG tumor in the left frontal lobe. The probe was moved over the tumor along a continuous trajectory. During linear 2D-acquisition, an arborization structure was observed of the vessels within the tumor. The arborous vascular structure seems to originate from a single point, dubbed the vessel of origin. Multiple 2D PDIs acquired during the 60 s measurement session, showed the arborous structure. The PDIs were stacked offline in a 3D-volume, which confirms the vessel of origin, as depicted here. See also Supplementary Video S4 for the 3D reconstruction. (L) Overview of the pre-resection tumor vasculature images as acquired intra-operatively for pt.#6. Pre-operative MRI showed a suspected LGG in the left occipito-parietal region. The probe was moved over the tumor along a continuous trajectory. During linear 2D-acquisition, a well-defined vascular structure was observed, delineating the tumor from the rest of the tissue. Multiple 2D PDIs acquired during the 60 s measurement session, were stacked offline in a 3D-volume, confirming the well-defined vascular area. See also Supplementary Video S5 for the 3D reconstruction. These last two examples highlight the potential of vascular mapping for brain-tumor delineations. fUS, functional ultrasound; LGG, low grade glioma; PDI, power doppler image.
