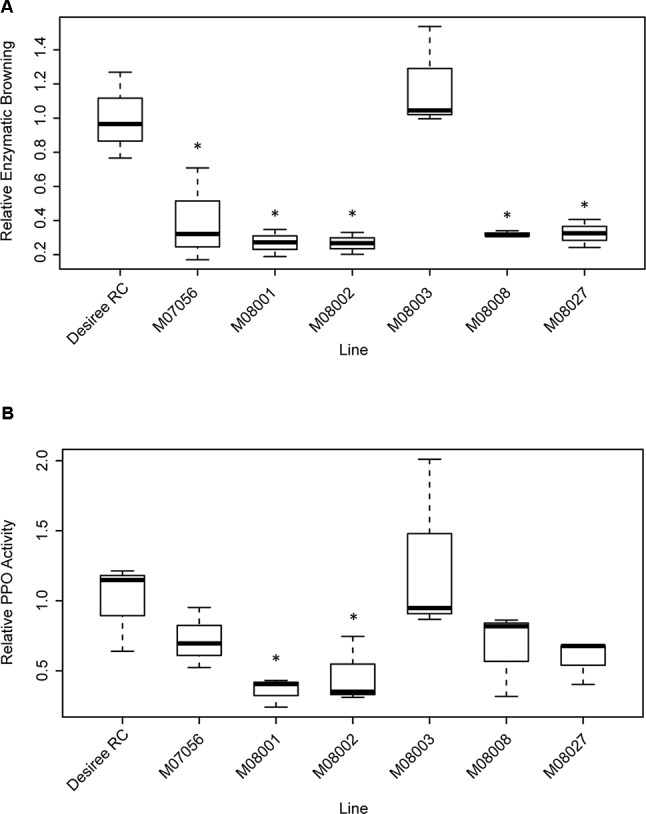
Figure 5.

Analysis of Relative Enzymatic Browning (A) and Relative PPO Activity (B) in tubers of selected edited lines. Each box represents data of three biological replicates of the edited lines and the control Desiree RC, the line across the box represents the median. The box represents the 25th and the 75th percentiles and whiskers represent the maximum and minimum value. Data are relative to the control line Desiree RC. Statistical differences with the control line Desiree RC are denoted *(p < 0.05).
