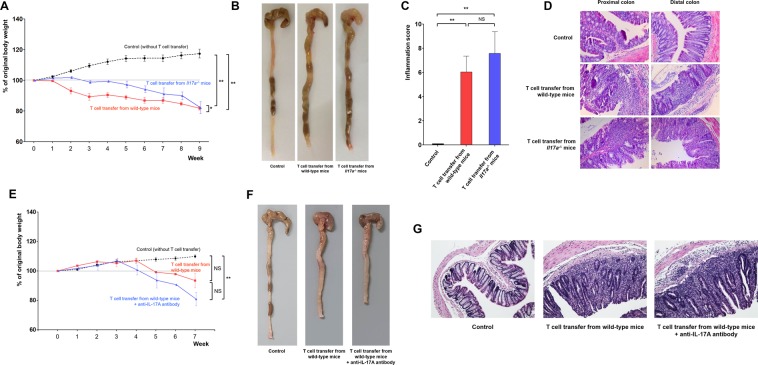
Figure 3.
CD4+CD45RBhi T cell transfer-induced colitis model. Bodyweight changes (A), representative gross photos of the colorectal area (B), inflammation scores (C), and representative microscopic images of histopathological examination (x200) (D) after T cell transfer from wild-type or Il17a−/− mice (Rag2−/− mice without T cell transfer: n = 13; Rag2−/− mice with T cell transfer from wild-type mice: n = 8; Rag2−/− mice with T cell transfer from Il17a−/− mice: n = 8). Bodyweight changes (E), representative gross photos of the colorectal area (F), representative microscopic images of histopathological examination (x200) (G) after T cell transfer from wild-type mice according to administration of anti-IL-17A antibody (Rag2−/− mice without T cell transfer [control]: n = 3; Rag2−/− mice received T cell transfer from wild-type mice: n = 2; Rag2−/− mice received T cell transfer from wild-type mice and anti-IL-17A antibody: n = 2). In the anti-IL-17A antibody group, 100 μL of secukinumab was injected intraperitoneally three times per week from the time of T cell transfer to the end of the experiment. Bars represent standard errors. *P < 0.05, **P < 0.01. NS, not significant.

