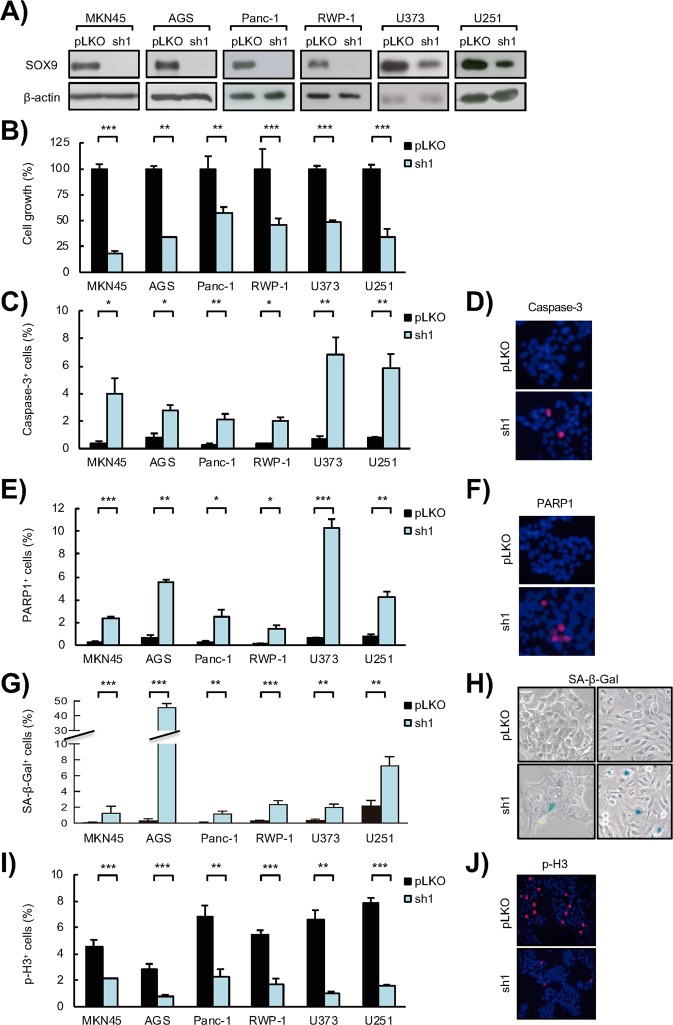
Figure 1.
SOX9 silencing impairs tumor cell survival, induces senescence and abrogates proliferation in cancer cells. (A) Representative Western blots of SOX9 protein expression in MKN45 and AGS GC cell lines, Panc-1 and RWP-1 PDAC cell lines, and U373 and U251 GBM cell lines lentivirally transduced with a specific shRNA against SOX9 (sh1) or the corresponding control vector (pLKO) (n ≥ 4). β-actin levels were used as a loading control. (B) Cell growth at day 5 (percentage of cells) in SOX9-silenced (sh1) cells respect to control (pLKO) cells (n ≥ 4). (C) Apoptosis represented by the percentage of active Caspase-3 positive cells in SOX9-silenced (sh1) cells and the corresponding control cells (pLKO) determined by immunofluorescence staining (n ≥ 4). (D) Representative image of active Caspase-3 positive cells in RWP-1 control (pLKO) and SOX9-silenced (sh1) cells. (E) Apoptosis represented by the percentage of cleaved PARP1 positive cells in SOX9-silenced (sh1) cells and the corresponding control cells (pLKO) determined by immunofluorescence staining (n ≥ 4). (F) Representative image of cleaved PARP1 in RWP-1 control (pLKO) and SOX9-silenced (sh1) cells. (G) Senescence represented as the quantification of the percentage of β-Galactosidase (SA β-Gal) positive cells in SOX9-silenced (sh1) cells and the corresponding control cells (pLKO) (n ≥ 4). (H) Representative images of SA β-Gal staining in RWP-1 (left) and U251 (right) control (pLKO) and SOX9-silenced (sh1) cells. (I) Proliferative capacity represented by the percentage of phospho-histone H3 (p-H3) positive cells (n ≥ 4) determined by immunofluorescence staining in control (pLKO) and SOX9-silenced (sh1) cells. (J) Representative image of p-H3 in RWP-1 control (pLKO) and SOX9-silenced (sh1) cells. Asterisks (*, ** and ***) indicate statistical significance (p < 0.05, p < 0.01, and p < 0.001, respectively).

