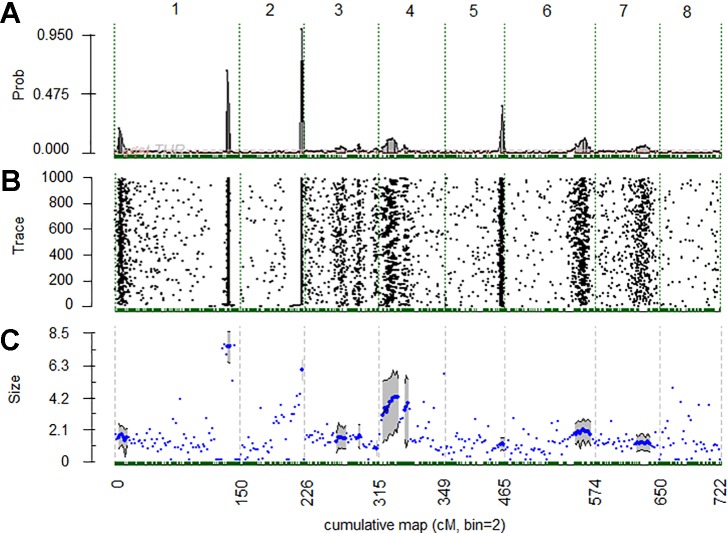
Figure 3.
(A) Posterior probabilities of quantitative trait loci (QTL) positions along the genome with a 2 cM bin resolution. (B) Trace plot of Markov chain Monte Carlo samples for QTL position. (C) Posterior mean (blue dots) and 90% credible region (gray shade) for estimate additive QTL effects for chromosomal regions of 2 cM bins with positive evidence (2lnBF10 > 2) for QTL presence. Vertical dashed lines identify the starts and ends of chromosomes.

