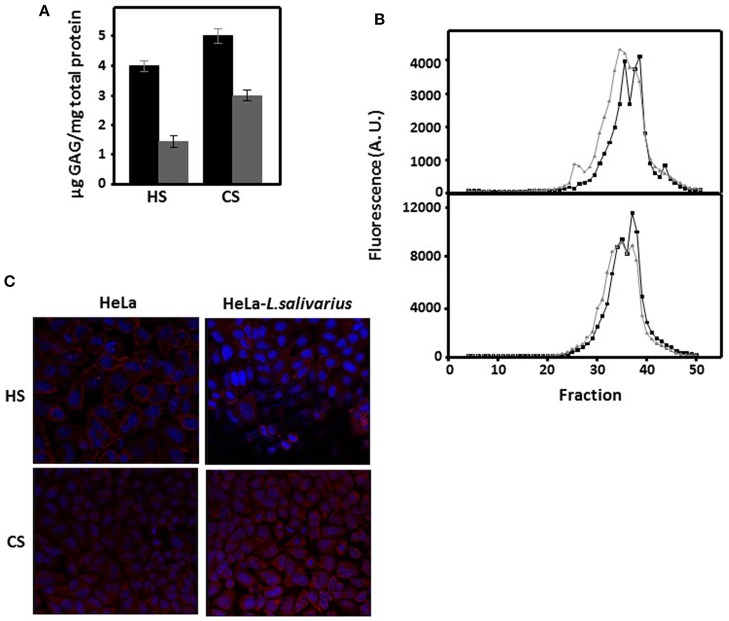
Figure 3.
Characterization of GAGs as a function of the interaction between HeLa cells and L. salivarius Lv72. (A) Quantification of HS and CS extracted from the surface of pure HeLa cell cultures (black bars) or those previously incubated with L. salivarius Lv72 (gray). The differences are statistically significant (p < 0.001 for HS) and (p < 0.01 for CS). The data are the result of at least four independent determinations. (B) Molecular exclusion chromatography of the HS (upper panel) and CS (bottom panel) chains extracted from the surface of pure HeLa cell cultures (black lines) or those previously incubated with L. salivarius Lv72 (gray). (C) Immunolocalization of HS and CS chains in pure HeLa cell cultures (left) or those previously incubated with L. salivarius Lv72 (right).

