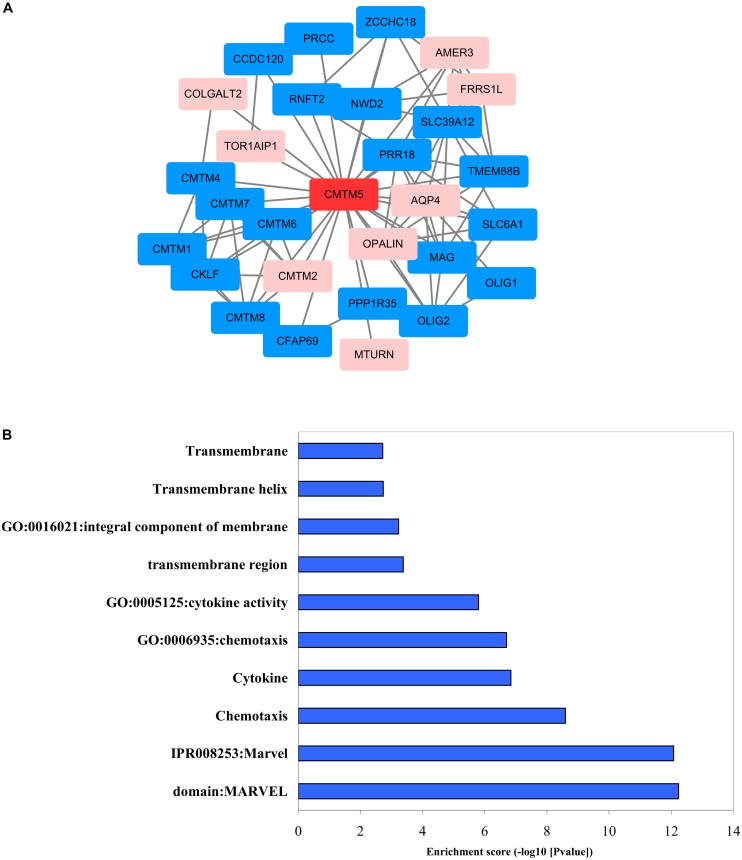
FIGURE 10.
Biomolecular regulatory network of CMTM5. (A) Protein–protein interaction network complex and modular analysis using STRING (blue nodes indicate positive correlation and pink nodes show negative correlation). (B) Top 10 clusters identified via GO enrichment and KEGG pathway analysis using DAVID.

