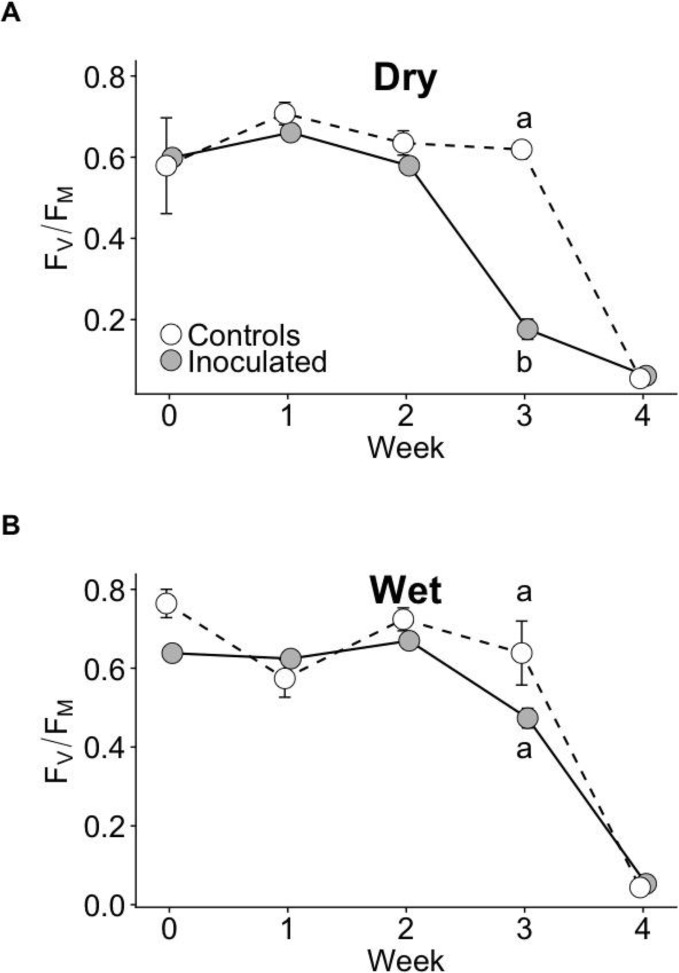
Figure 3.
FV/FM time courses of control and inoculated groups in dry (A) and wet (B) families measured weekly before and throughout drought. Drought was imposed after week 0 (when seedlings were ~13 months old). Error bars represent ± SE. At week 3, letters indicate statistically significant differences among the four groups at P ≤ 0.05. No significant differences among groups were detected at other time points. N = 7.

