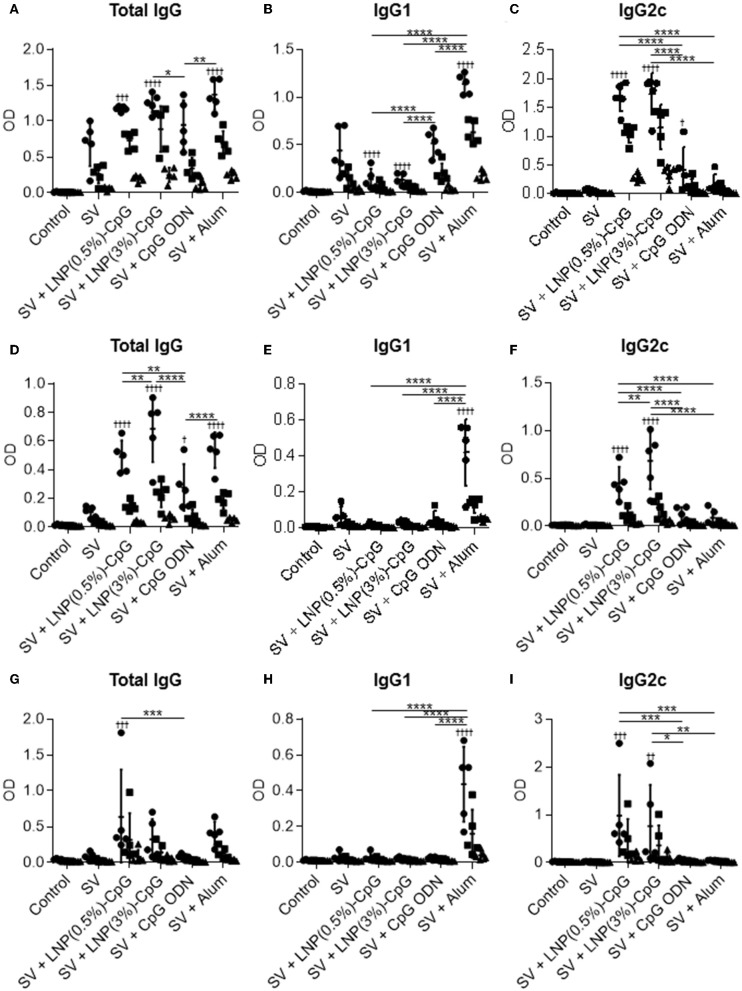
Figure 5.
Hemagglutinin (HA)- and neuraminidase (NA)-specific antibody responses in vivo. Levels of HA from Cal7-specific total IgG (A), IgG1 (B), and IgG2c (C); of NA from Cal7-specific total IgG (D), IgG1 (E), and IgG2c (F); and of HA from PR8-specific total IgG (G), IgG1 (H), and IgG2c (I) in plasma were evaluated by using ELISA 7 days after final immunization. The same plasma samples as used in Figure 4 were used here. We used 800- (•), 4000- (■), and 20,000- (▴) fold diluted plasma samples for (A–F) and 32- (•), 160- (■), and 800- (▴) fold diluted plasma samples for (G–I). n = 5. Data are means ± SD. Significant differences were analyzed only in the 800-fold-diluted plasma samples (A–F) and the 32-fold-diluted plasma samples (G–I). †P < 0.05, ††P < 0.01, †††P < 0.001, ††††P < 0.0001 vs. group immunized with SV alone; *P < 0.05, **P < 0.01, ***P < 0.001, ****P < 0.0001 as indicated by Tukey's test.

