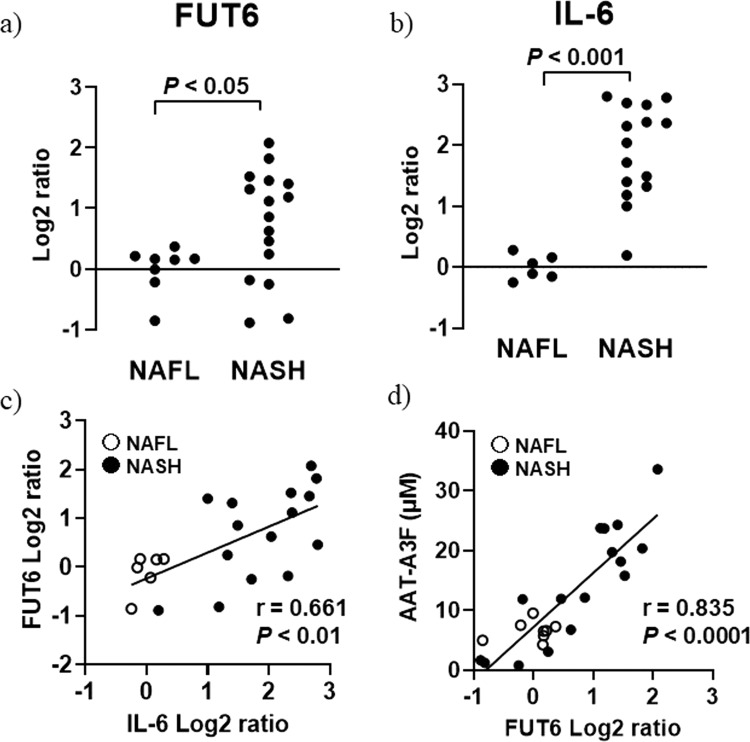
Figure 4.
Gene expression analysis. (a) The vertical axis represents the FUT6 expression level (log2 scale), and the horizontal axis represents the patient groups. (b) The vertical axis represents the IL-6 expression level (log2 scale), and the horizontal axis represents the patient groups. (c) The vertical axis represents the FUT6 expression level (log2 scale), and the horizontal axis represents IL-6 expression level (log2 scale). A scatter diagram of FUT6 and IL-6 expression is shown. (d) The vertical axis represents the AAT-A3F expression level in μM, and the horizontal axis represents the FUT6 expression level (log2 scale). A scatter diagram of AAT-A3F and FUT6 expression is shown.

