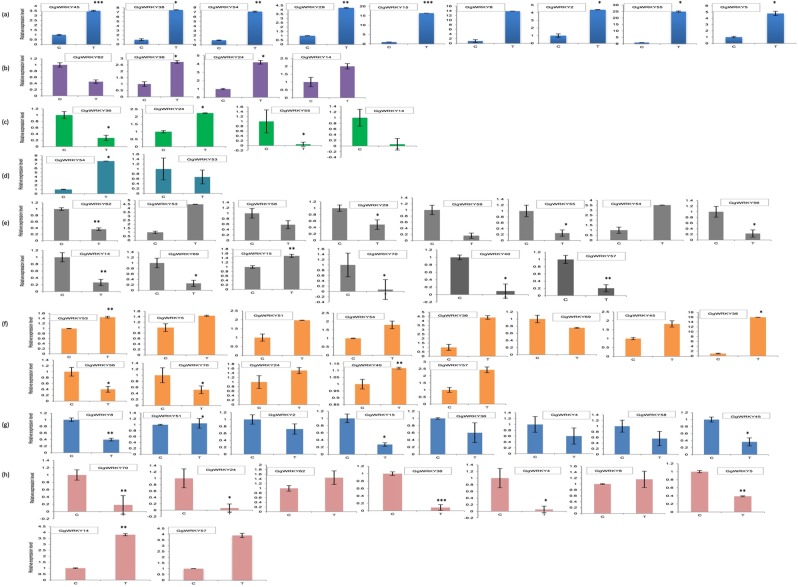
Figure 9.
Expression profiles of selected GgWRKY genes under eight different stresses. The Y-axis indicates relative expression level and X-axis indicates control shoot tissues (C) and treated shoot tissues (T). (a) expression patterns under etiolated conditions; (b–h) expression profiles under heat, UV, wounding, cold, dark, carbon starvation and salinity, respectively. Actin was used as internal reference. Three biological replicates were used to calculate error bars using standard deviation. Asterisks indicate that the corresponding gene was significantly up- or down regulated in a given treatment (*P ≤ 0.05; **P ≤ 0.01; ***P ≤ 0.001).

