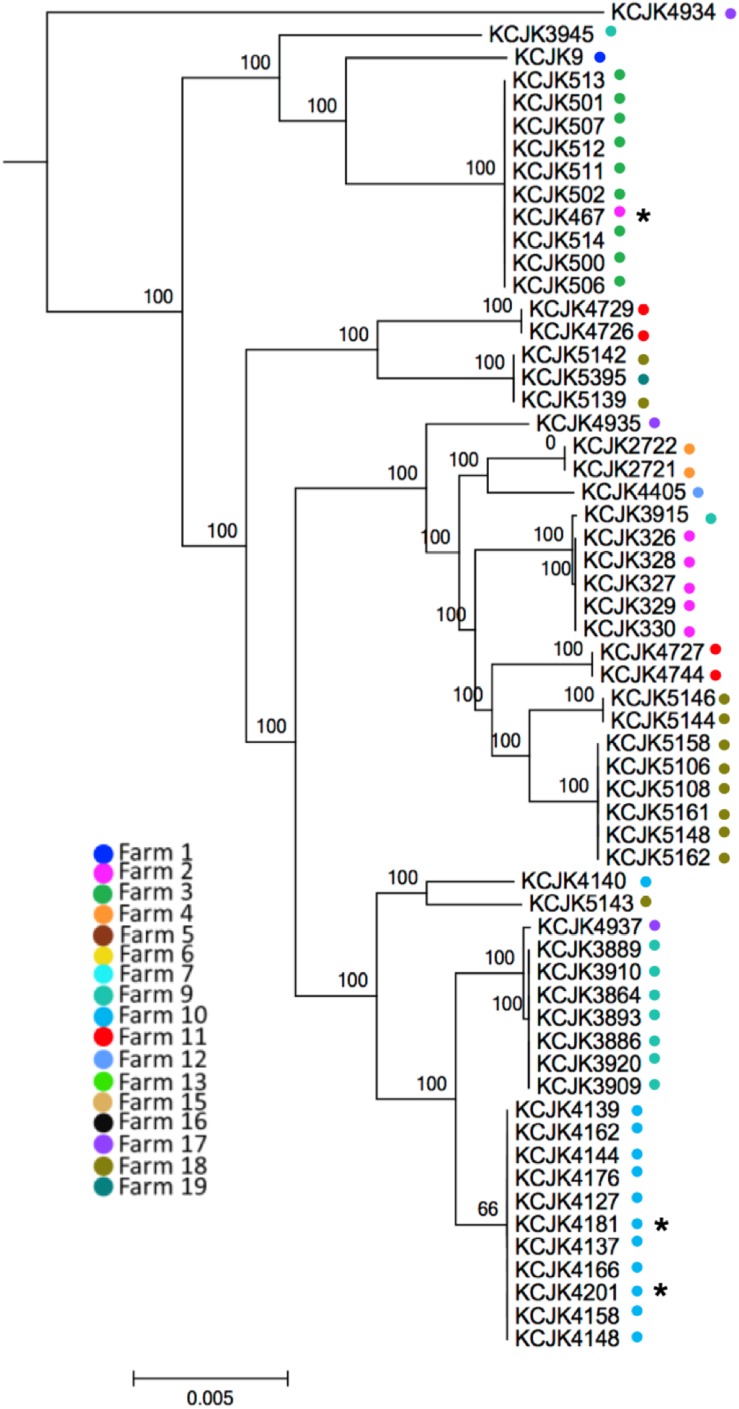
FIGURE 2.
Phylogenetic tree between CTX-M/CMY-2 producing E. coli isolates based on core-genome alignment The core-genome phylogenetic tree was generated using Parsnp. The isolates from different farms were indicated by different colored dots. Environmental isolates were marked with an asterisk (∗). The scale bars indicate the mean numbers of nucleotide substitution per site.

