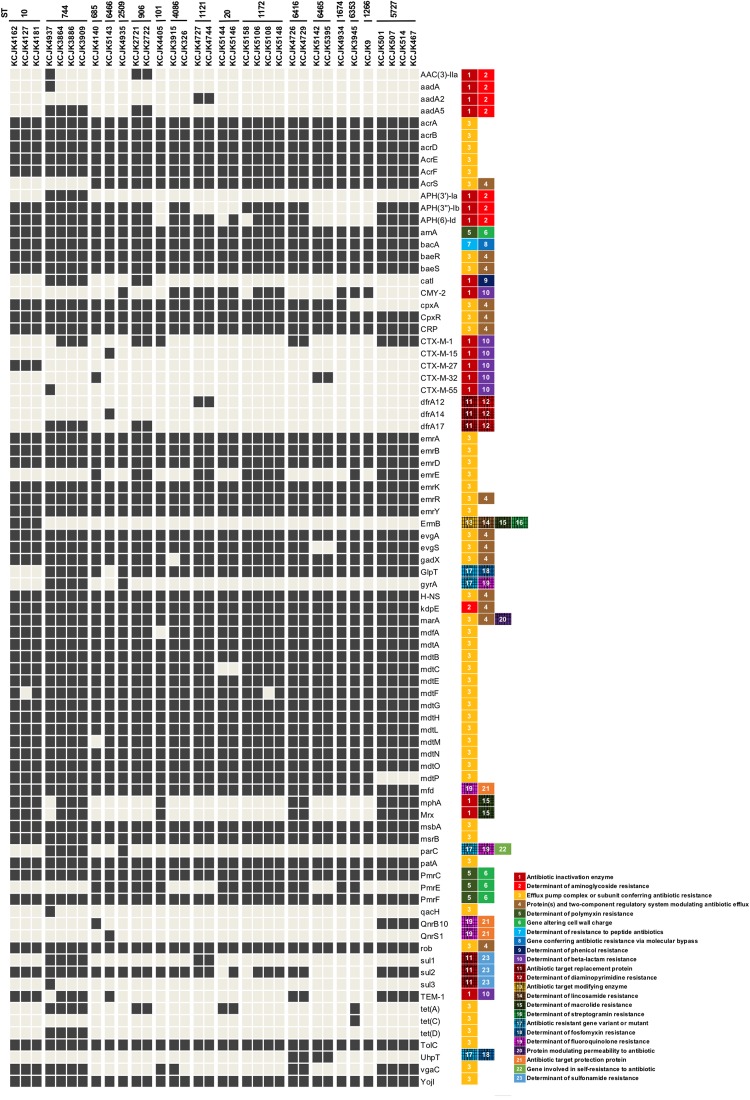
FIGURE 4.
Distribution of antimicrobial resistance genes in representative isolates Thirty-four representative isolates were selected based on farm location, sample type, and sequence homology and identified ARGs using CARD database. Only ARGs that indicated the identity higher than 95% were included. The classification of ARGs was based on the CARD database and listed next to ARGs. Black and gray squares indicate the presence and absence of ARGs, respectively.

