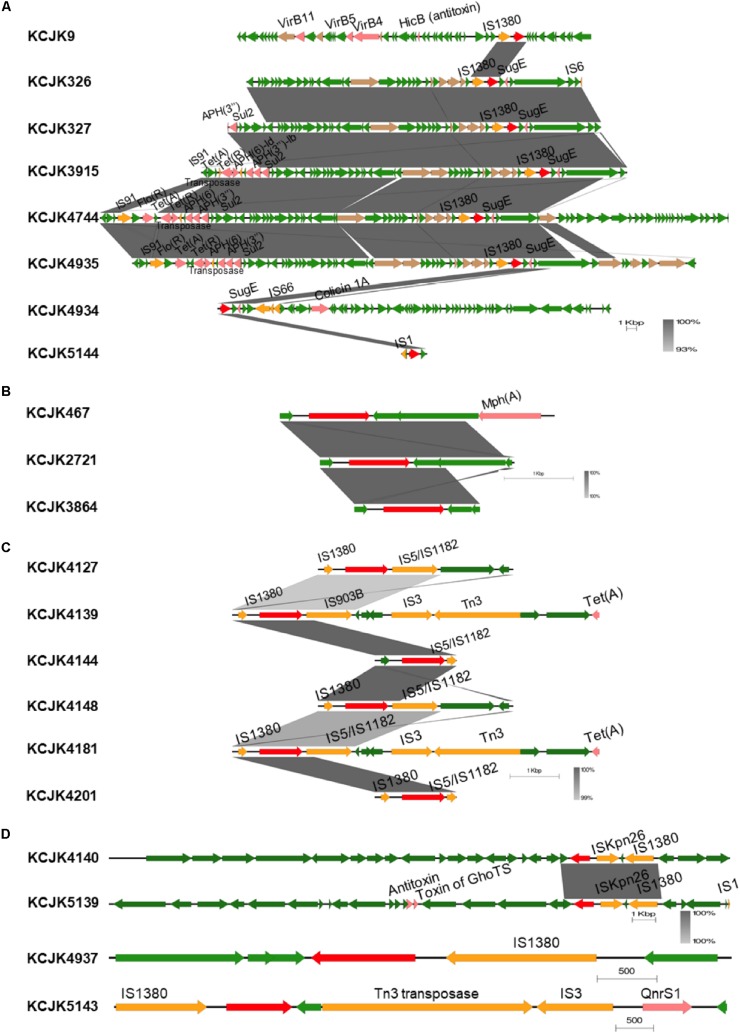
FIGURE 8.
Genetic environment of β-lactamase genes in representative isolates Linear map shows the regions surrounding β-lactamase genes in each isolate. Isolates encode CMY-2 (A), CTX-M-1 (B), CTX-M-27 (C), and CTX-M-32, CTX-M-15, and CTX-M-55 (D) are presented. Only isolates showing different structures were included, and sequence homology was compared if the isolates carried same β-lactamase gene. Gradient-color between linear maps indicates the similarity between isolates. β-lactamase genes, other virulence factors, insertion sequences, conjugal transfer genes, and general CDS are indicated by red, pink, yellow, brown, and green arrows, respectively.

