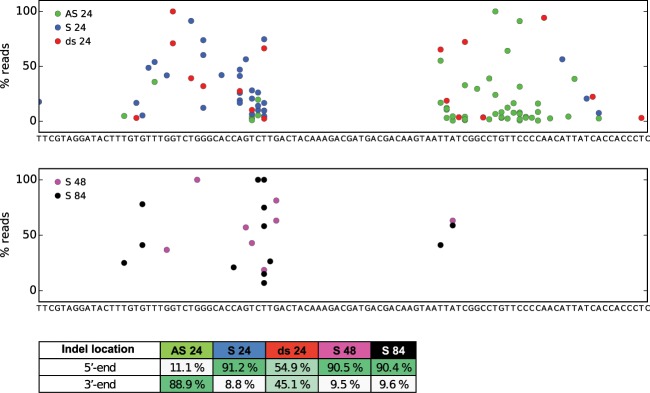
Figure 3.
Analysis of indel locations. All the sequence variants were extracted from the group called “Perfect FLAG + indels”. The sequences were aligned to the reference gene containing the inserted sequence. The read count for each indel-containing variant was then converted to percentage of the total read count of variants from the “Perfect FLAG + indels” for all individuals. The percentages were plotted on the reference sequence as colored dots (a) AS 24 ODN (green), S 24 ODN (blue) and ds 24 ODN (red). (b) S 48 ODN (pink) and S 84 ODN (black). In order to analyze the difference in indel positions between the different groups, the percentages of indels located either at the 5′- or 3′-end of the inserted sequence was calculated for each group and is shown in (c).

