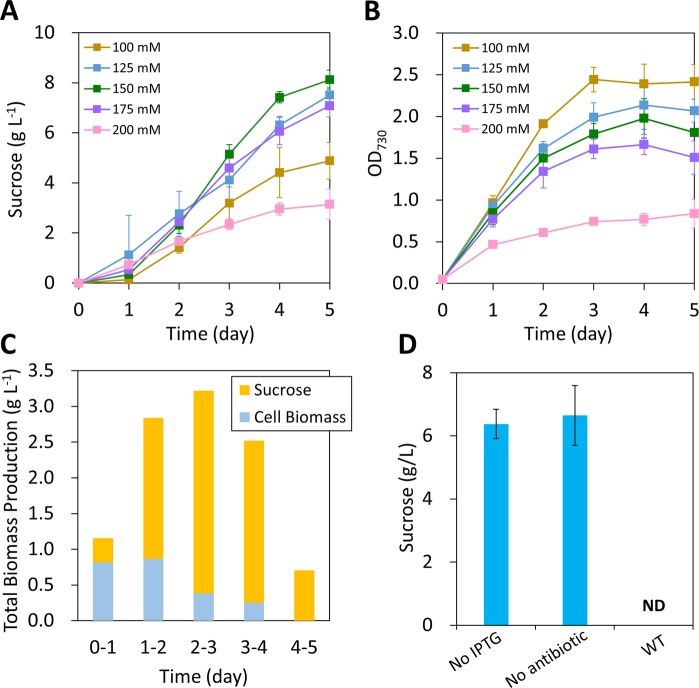
Figure 2.
Sucrose production in cscB-expressing Synechococcus 2973. (A) Time-course of sucrose production in the cscB-expressing strain in BG11 medium with various concentrations of NaCl. (B) OD730 of the cscB-expressing strain. (C) Carbon partitioning between sucrose and cell biomass (BG11 with 150 mM NaCl). (D) Sucrose production in different culture conditions with 150 mM NaCl (5 days). The WT Synechococcus 2973 was included as a control. The data represents mean ± sd from three biological replicates. ND, not detected.

