Figure 2.
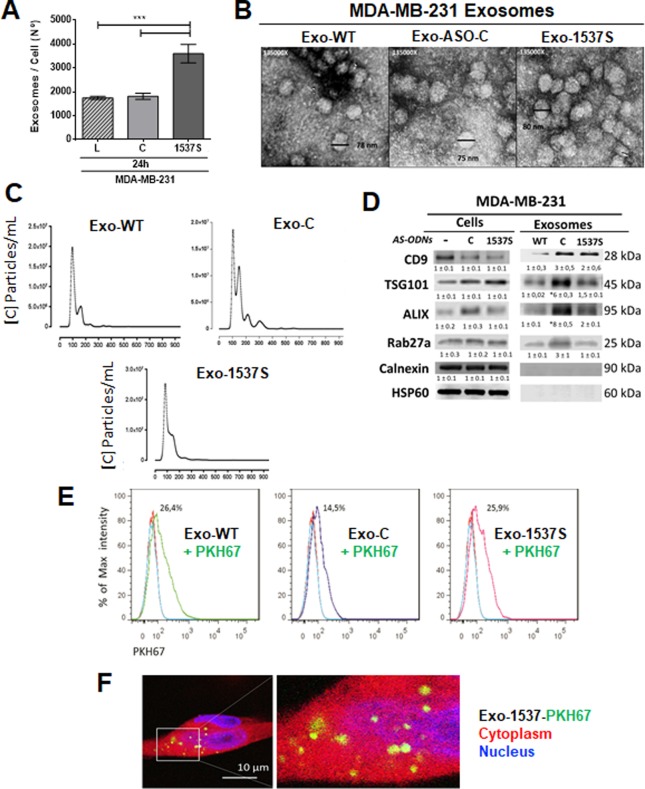
Characterization of Exo-WT, Exo-C and Exo-1537S exosomes and incorporation into MDA-MB-321 cells. MDA-MB-231 cells were transfected for 24 h as in Fig. 1 and exosomes were purified from the supernatants, obtaining 3 exosome preparations: Exo-WT (exosomes obtained from untreated cells), Exo-C (exosomes obtained from cells transfected with ASO-C) and Exo-1537 S (exosomes obtained from cells transfected with ASO-1537S). (A) Quantification of number of exosomes (NTA) purified from cells under the different treatments. Data are represented as average ± SEM (***p < 0,01, n = 3). (B) Exosome integrity of all samples was evaluated by Transmission Electron Microscopy (TEM) (135,000×). Bars indicate the diameter of some exosomes. (C) Exo-WT, Exo-C and Exo-1537 S samples were diluted so as to count 10 to 100 particles per record. The latter were then analyzed to determine the size with an approximation of the quantity of particles (concentration). The graph shows size distribution and number of particles in relation to diameter, with a mean diameter between 103 at 124 nm. (D) 30 µg of total exosome protein content of each sample was used to evaluate the classical exosome markers by Western blot: CD9, TSG101, ALIX and Rab27a. Calnexin and HSP60 were used as negative controls. A representative result for each blot is shown (n = 3). (E) Exosomes (Exo-WT, Exo-C and Exo-1537S) were labeled with the fluorescent dye PKH67 (green signal) and the number of exosomes was quantified by NTA. To perform the internalization protocol, labeled exosomes were added to MDA-MB-231 cells (1000 exosomes per cell), and then incubated for 3 h at either 37 °C or 4 °C. The internalization of Exo-WT, Exo-C and Exo-1537S exosomes into MDA-MB-231 cells was evaluated by fluorescence-activated cell sorting (FACS). Data was presented as percentage of signal intensity (n = 3) and was also visualized by confocal microscopy (F), where the cytoplasm was stained with 2 µM CellTracker™ Red CMTPX (red signal), exosomes were labeled with PKH67 (green) and the nucleus was counterstained with DAPI (blue). A representative image of Exo-1537 S internalization into MDA-MB-231 cells is shown (magnification 100 × ).

