Figure 6.
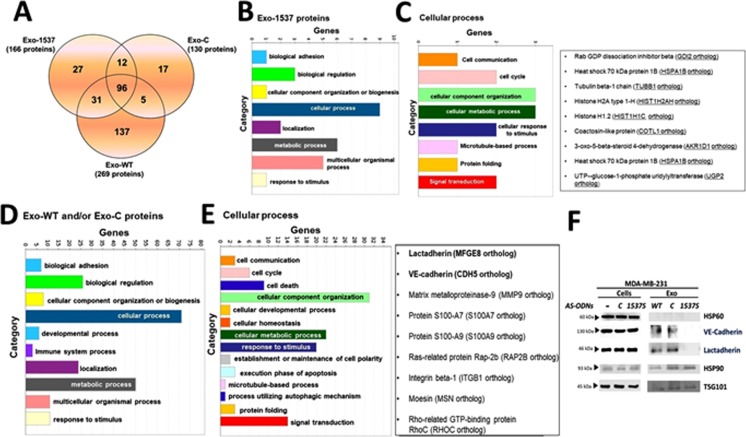
Mass spectrometry and pathway analysis of Exo-WT, Exo-C and Exo-1537S proteins. (A) Venn diagram of proteins identified in exosomal preparations. (B) Gene ontology (GO) enrichment analysis of proteins only found in Exo-1537S (27 proteins) in which the top 8 significantly-enriched GO categories are indicated under “Cellular process”. (C) Gene ontology (GO) enrichment analysis of Exo-1537S proteins in which the 8 significantly enriched GO categories under “Cellular process” (depicted in B) are indicated (left panel). The list (right panel) shows several protein candidates representing each enriched category. (D) Gene ontology (GO) enrichment analysis of Exo-WT and/or Exo-C proteins (159 proteins) showing the top 10 significantly-enriched GO categories under “Cellular process”. (E) Gene ontology (GO) enrichment analysis of Exo-WT and/or Exo-C proteins showing the 14 significantly enriched GO categories under “Cellular process” (depicted in D). The list (right panel) shows several protein candidates associated to cancer progression identified in each category. (F) Western blot analysis of invasion-promoting protein candidates VE-Cadherin and Lactadherin, obtained from the proteomic analysis. Results from a representative experiment are shown. Hsp60 was included as a negative control; Hsp90 and Tsg101 were used as positive markers (n = 3).

