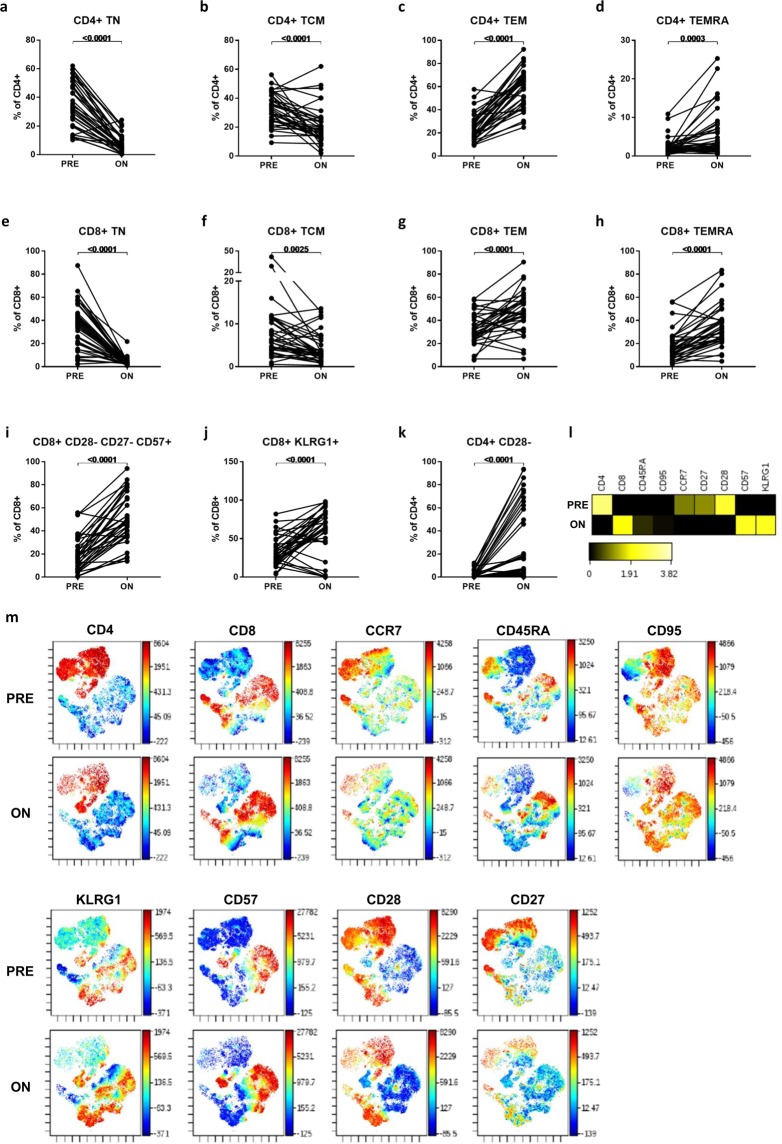
Figure 2.
Naïve, memory and senescent T-cell subset changes On-treatment with FTY compared to Pre-treatment. Frequencies of naïve, memory and senescent T-cell subsets within total CD4 + and CD8 + T cells were compared in pre- and on-treatment samples using paired t-tests (A–K). Combined down-sampled data from nine patients’ matched pre- and on-treatment samples was analysed using viSNE, gating on CD3 + T cells. Relative expression of each marker within the total CD3 + population is shown in the heatmap (L), which displays the fold-change of each marker relative to the lesser of the two time points. viSNE plots (tSNE1 and tSNE2 plotted on x and y axes respectively) coloured by each marker (M) show the treatment-induced changes in the expression of these molecules across the CD4 + and CD8 + clusters.

