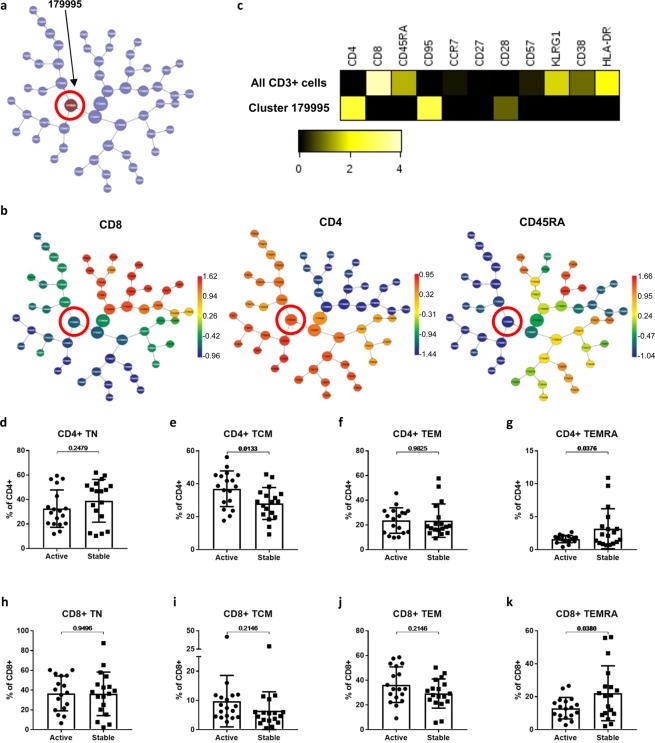
Figure 5.
Pre-treatment differences in naive and memory T-cell subsets of patients with subsequently Active versus Stable disease On-treatment. Results from a CITRUS unbiased correlative analysis of pre-treatment samples comparing Active versus Stable cohorts are shown. Correlations between pre-treatment immune cell cluster abundances and on-treatment disease activity cohort were assessed using the significance analysis of microarrays (SAM) method with a false discovery rate of <1%. The cluster found to be significantly different in abundance between groups is shown in the CITRUS cluster tree (A). The cluster tree is shown coloured by level of expression of CD8, CD4 and CD45RA (B), where the colour scale bars indicate the transformed intensity of marker expression per cluster. A heatmap comparing the significant cluster with all CD3 + T cells is shown (C) and displays a transformed ratio of median marker expression using the lower of cluster and all CD3 + cells as the reference for each marker. The frequencies of traditionally analysed CD4 + and CD8 + naïve and memory T cells subsets in Active versus Stable cohort pre-treatment samples were compared using unpaired t-tests (D–G).

