Figure 2.
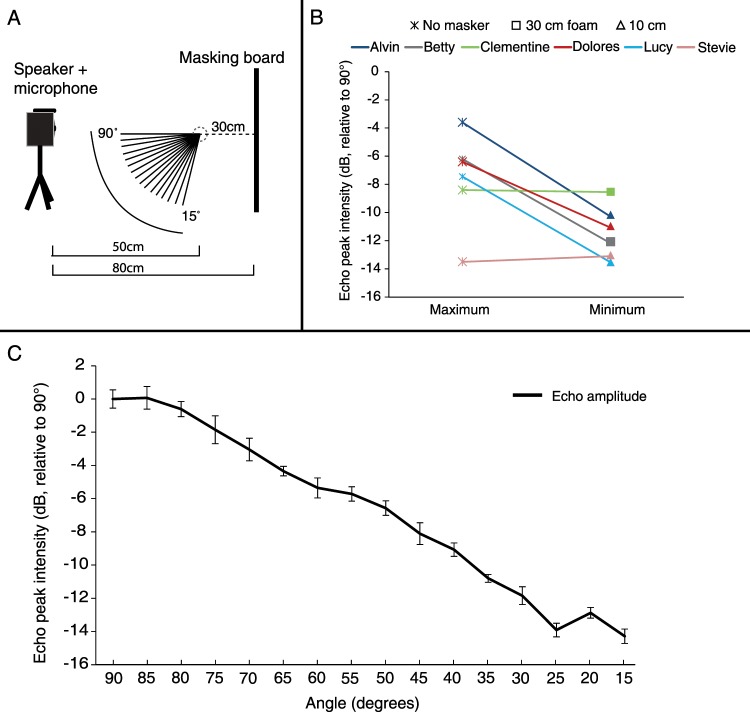
Ensonification of the masking board at different angles. (A) The set-up of the ensonification experiment. Bat-like signals were played through a speaker and returning echoes were recorded with a microphone located above the speaker. Recordings were performed at a distance of 50 cm from the platform with an additional 30 cm from the masking board (80 cm total), at sixteen angles. The platform was not present during the ensonification experiment. (B) The echo intensity for the smallest angles used by individual bats in the no masker condition (maximum) and the smallest angles used in any of the other experimental conditions (minimum). Colors indicate the different individuals and shapes indicate the condition in which the angle was minimal. (C) Echo peak intensity (dB) of the masking board at sixteen different vertical angles (mean ± SE). Echoes were band-pass filtered between 35–45 kHz. Intensities and SE are in logarithmic scale. Means were normalized relative to 90 degrees.

