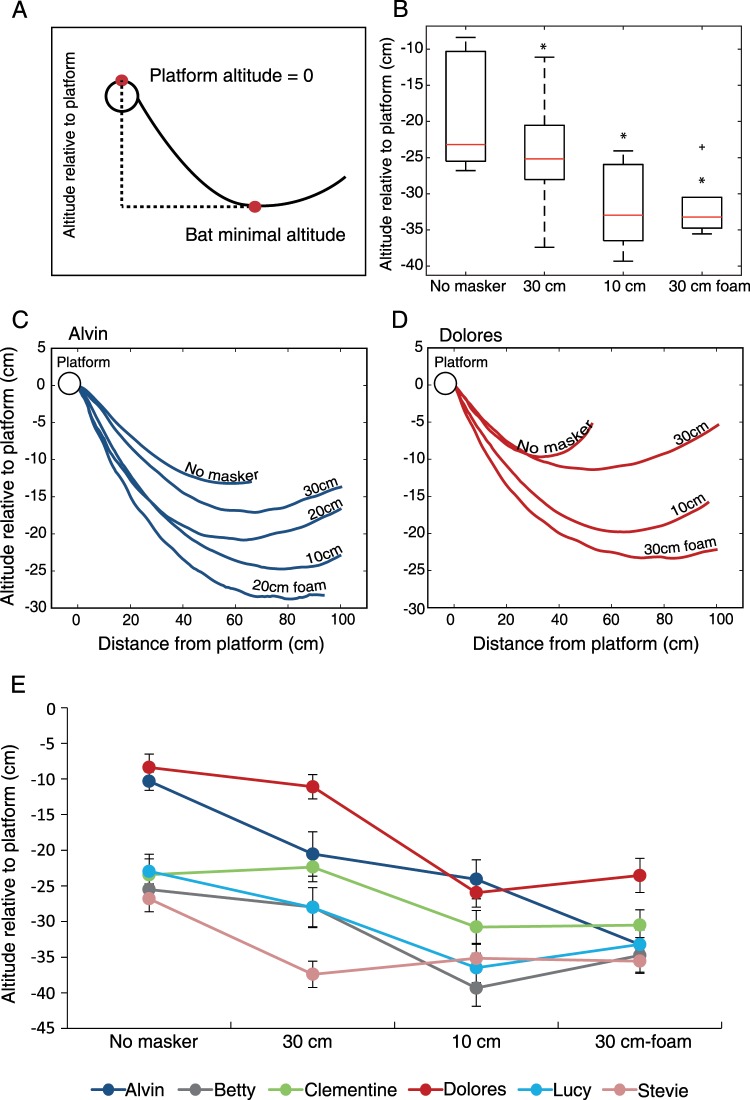
Figure 3.
Minimal altitude of flight relative to the landing platform. (A) The minimal altitude was measured relative to the height of the platform which was normalized to zero. (B) The minimal altitude of flight (cm) relative to the platform for all bats in the different conditions, n = 6 bats. The whiskers indicate the extreme data points (beyond the percentiles) that are not considered outliers. Plus symbols indicate outliers (see MATLAB for outlier definition) and asterisks indicate a significant change in altitude relative to either the no masker condition (for 30 cm and 10 cm) or to the 30 cm styrofoam condition (for 30 cm foam). (C,D) Altitude along the flight path. Each line represents the average trajectory of each condition. The circle represents the location of the landing platform (at 0,0). Note the increase in the vertical curvature as sensory conditions become more difficult. Examples are shown for two of the six bats. (E) The minimal altitude of flight in the different conditions for the six individual bats (different colors; mean ± SE). The same trend of decrease in altitude can be seen in five out of the six bats. The sixth bat (Stevie) showed an initial decrease from no masker to 30 cm and then kept a relatively similar altitude. The first bat, ‘Alvin’, performed an additional condition of 20 cm that corresponds to a different foam condition of 20 cm foam. This is because this bat did not have the 30 cm foam condition, and so in order to have a proper comparison between the conditions we compared the 20 cm styrofoam to 20 cm foam. All other conditions are the same.

