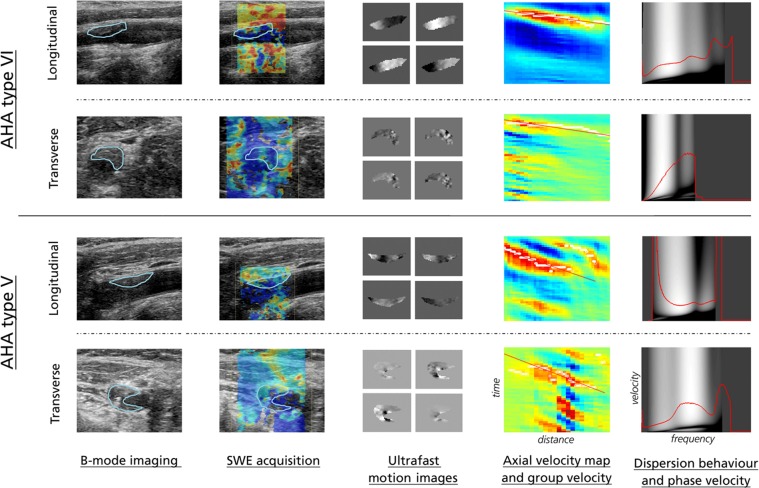
Figure 2.
Overview of generated SWE images. From left to right: Ultrasound B-mode images, SWE acquisition, ultrafast motion images obtained from data autocorrelation (four snapshot motion images displayed, from upper left to lower right), axial velocity map (space-time domain) with TTP-estimated group velocity (red slope), and Fourier-generated dispersion behavior and phase velocity map (velocity-frequency domain). Examples are given in longitudinal and transverse view for one AHA type VI, and one AHA type V plaque, respectively. Note that for the dispersion curves, data was discarded in frequency-ranges where corruption from noise or higher-order modes seemed visually apparent (in this case, lower frequency-range data for the AHA type V plaque in the longitudinal view plan was discarded from further analysis, as was higher frequency-range data for the AHA type VI plaque in transverse view). For all other presented cases, the 200–500 Hz range was deemed appropriate for inclusion. All examples are shown over a frequency range of 0–750 Hz.

