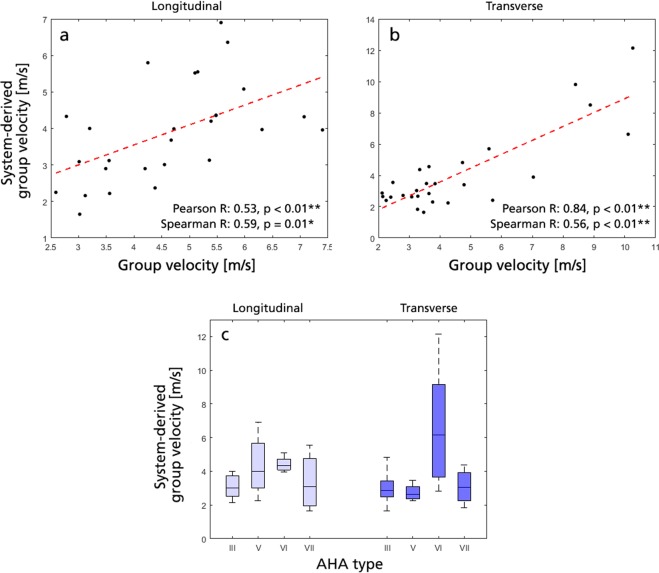
Figure 6.
Comparison between group velocity derived using the approach described in the method section, vs. using a vendor-specific system-derived shear wave output. (a) Correlation plot in longitudinal view, with a linear regression slope of m = 0.55. (b) Correlation plot in transverse view, with a linear regression slope of m = 0.89. (c) Vendor-specific system-derived group velocity as a function of AHA type, where no statistical differentiation could be inferred for the AHA type VI plaques against all other evaluated plaque types, respectively.

