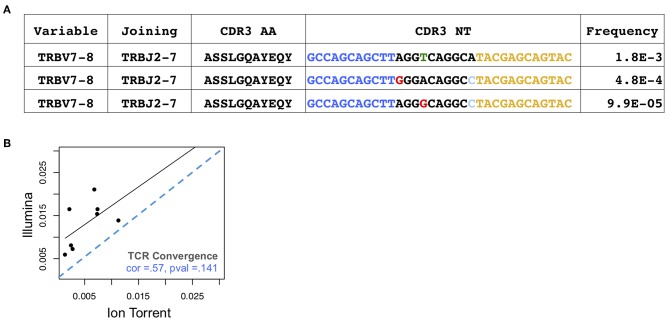
Figure 2.
Assessment of TCR convergence. (A) Example of a convergent TCR group detected in the peripheral blood of an individual with melanoma. This group consists of three TCRβ clones that are identical in TCRβ amino acid space but have distinct CDR3 NT junctions owing to differences in non-templated bases at the V-D-J junction. Blue indicates bases contributed by the variable gene while yellow indicates bases contributed by the joining gene. Red arrows indicate positions where clones differ. Substitution sequencing errors and PCR errors can create artifacts that resemble convergent TCRs. (B) TCR convergence, calculated as the aggregate frequency of clones sharing an amino acid sequence with at least one other clone. Blue dashes indicate position of identity line.

